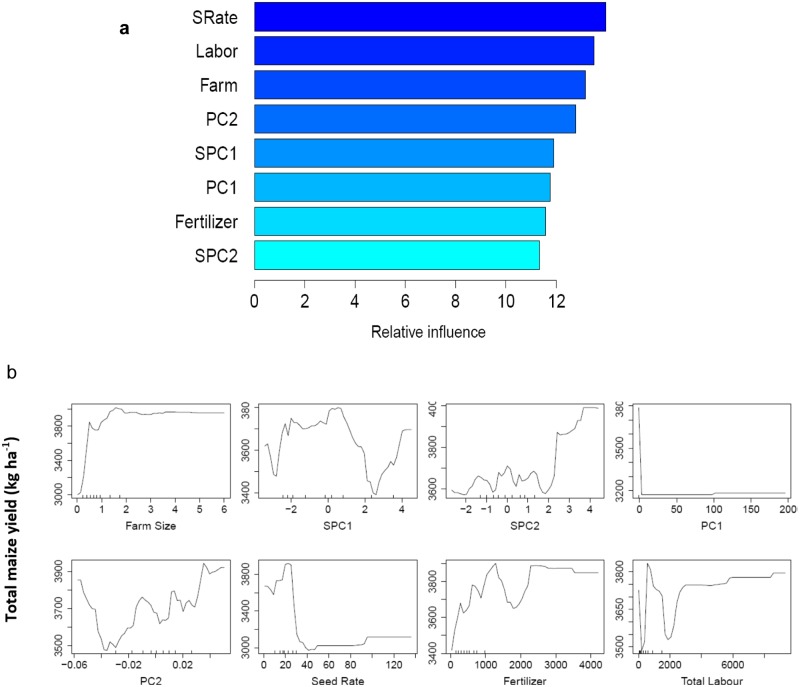
Fig 9.
Plots showing a) RF variable importance plot where explanatory variables are arranged according to their relative contribution to the overall prediction process. Seed rate, farm size, and total labor are denoted as SRate, Farm, and Labor, respectively and b) partial dependence plots on the eight influential variables (farm size, SPC1, SPC2, PC1, PC2, seed rate, fertilizer, and total labor) used in random forest regression. The y-axes in all the plots represent total maize yield (kg ha-1).

