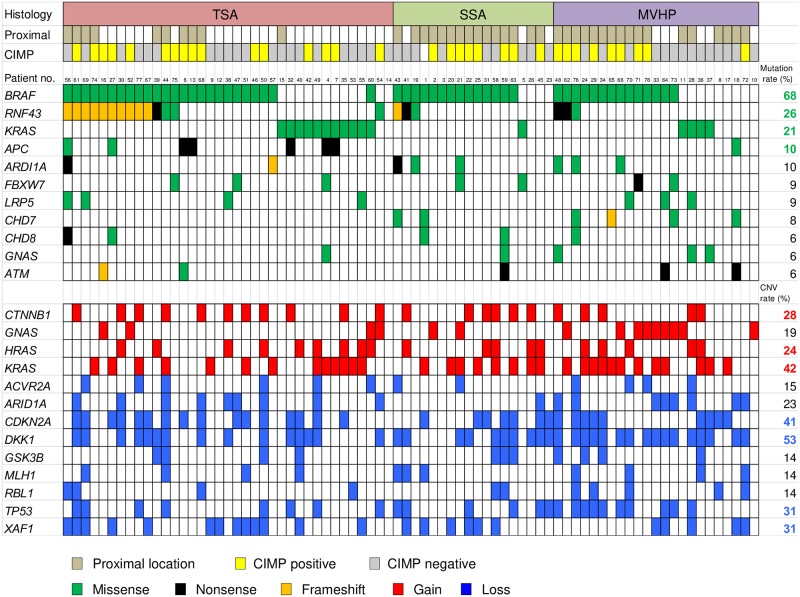
Fig 1. Summary of somatic mutations and CNVs across 78 serrated lesions.
Profiles of gene mutations and CNVs within individual samples are grouped with respect to histological types. In the upper panel, the top row indicates the histology, the second row indicates the tumor location, and the third row indicates the CIMP status. Columns correspond to the individual cases. In the middle panels, frequently mutated genes, colored to indicate the type of mutation, and their mutational frequency are shown. In the lower panels, CNVs frequently detected in colorectal serrated lesions are shown.

