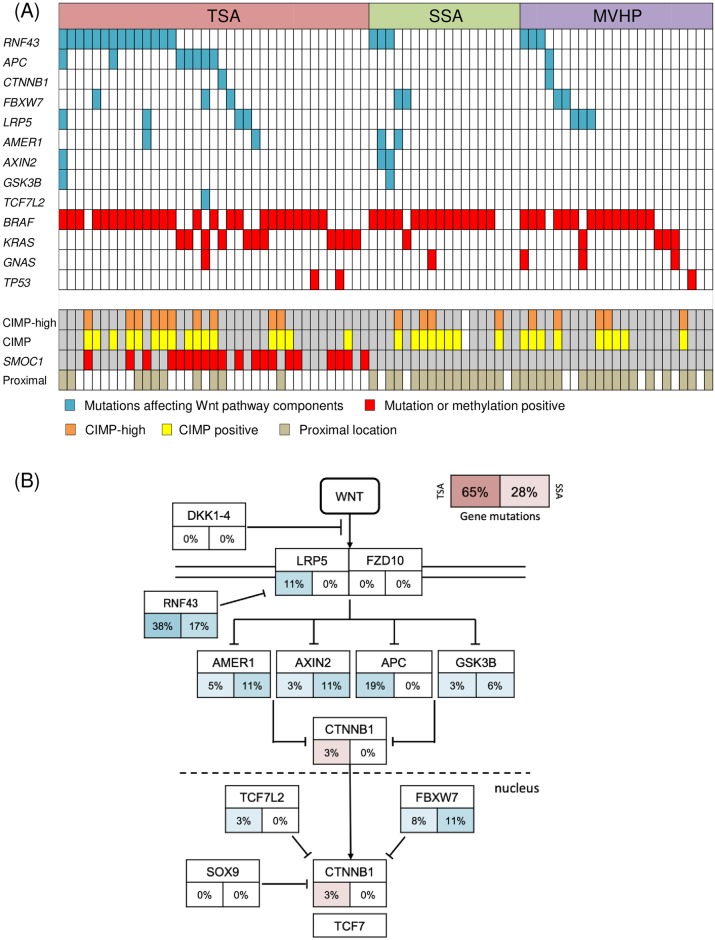
Fig 3. Gene mutations leading to dysregulation of Wnt signaling pathway in serrated lesions.
(A) Representative mutation and methylation profile across 78 serrated lesions. Blue coloration indicates gene mutations affecting Wnt pathway components, while red coloration indicates positivity for gene mutations or methylation. (B) Frequencies of gene mutations leading to dysregulation of Wnt signaling in TSAs and SSAs. Alteration frequencies are expressed as percentages of all cases. Frequencies of gene mutations in TSAs are shown on the left, while those in SSAs are shown on the right. Red denotes activated genes and blue denotes inactivated genes.

