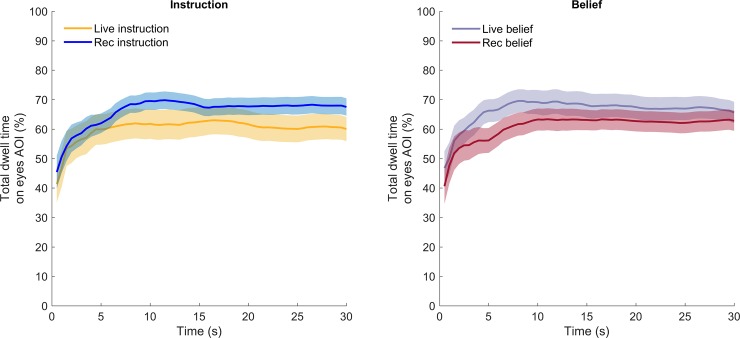
Fig 8. Relative total dwell time on the eyes AOI over time as a function of instruction-type (left panel) and participants’ beliefs (right panel).
Lines depict average relative total dwell time (%) over time (in seconds). Shaded regions represent the standard error of the mean. The relative total dwell time on the eyes AOI is consistently lower for the live-instruction group compared with the pre-recorded instruction group. Conversely, the relative total dwell time on the eyes AOI is consistently higher for the live-belief group compared with the pre-recorded belief group.

