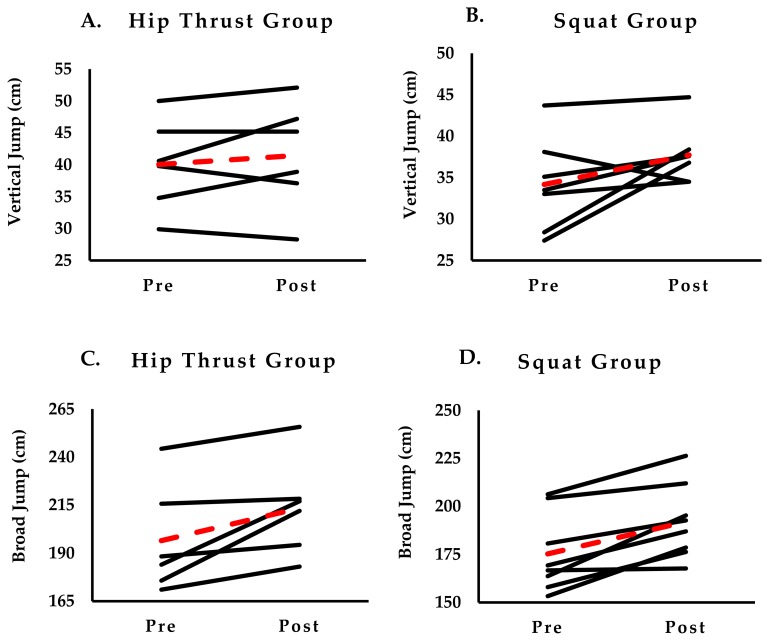
Figure 3.
Individual athlete changes in jumping following 6 weeks of in-season resistance exercise in female high school soccer players. Black lines represent pre- to post-intervention changes. Red dotted line represents the group average. Not all individuals are visible as several values overlapped with others (i.e., two individuals with similar values).

