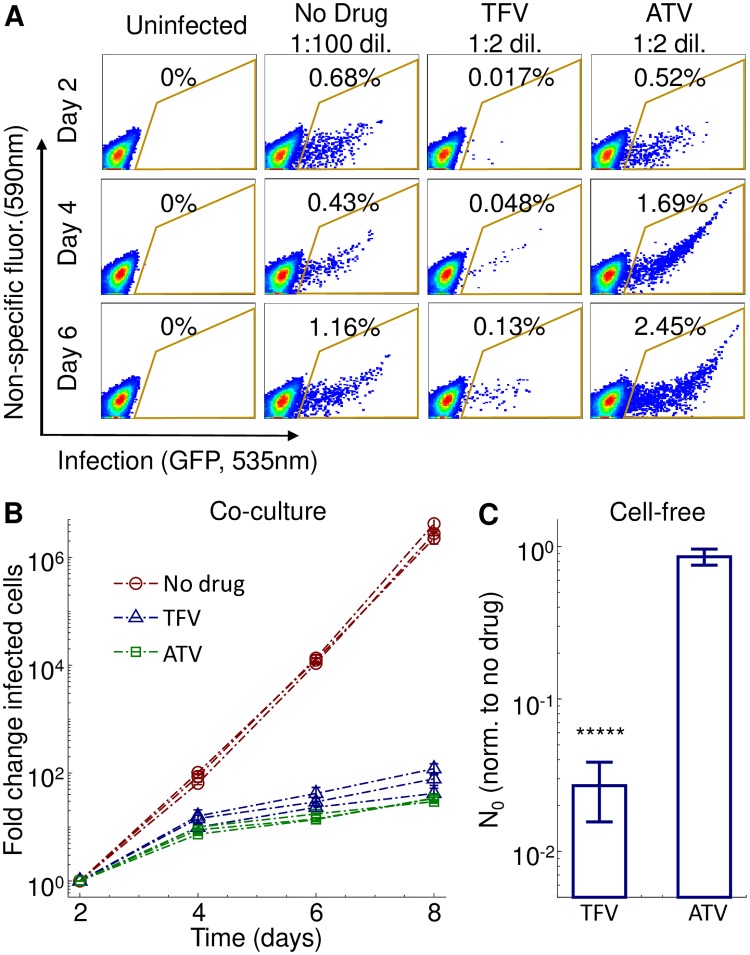
Fig 3. Experimental measurement of drug effect on R0 and the initial number of infected cells N0.
(A) Flow cytometry plots of the fraction of infected cells at different days post infection in the absence of drug or presence of 60 μM TFV or 16 nM ATV. Day 2 is the first time-point after the initial cell-free infection, corresponding to approximately one viral cycle. X-axis is GFP fluorescence, y-axis is autofluorescence, with the fraction of infected cells corresponding to the cells within the area outlined in yellow. Infected cell cultures in the presence of either drug were diluted 1:2 every 2 days. Infected cultures in the absence of drug were diluted 1:100 into uninfected cells every 2 days. (B) Measurement of R0 in the absence and presence of drug. The number of infected cells at each time-point is normalized by the number of infected cells at day 2 and corrected for the dilution factor used in each infection cycle. 3 independent experiment were performed, with each point denoting the mean ± std of 3 experimental replicates per experiment. Infection in the absence of drug is shown as red circles, TFV as blue triangles, and ATV as green squares. (C) Effect of drug on N0. For each drug condition N0 was measured 2 days after cell-free HIV infection and normalized by N0 for no drug. Mean ± std of 3 independent experiments, where normalization was with N0 in the absence of drug as measured in the same experiment. Raw numbers of infected cells averaged over all experiments were 1.3 × 10⁴ ± 1.5 × 10³ for no drug infection, 3.4 × 10² ± 1.3 × 10² for TFV and 1.1 × 10⁴ ± 7.4 × 10³ for ATV (mean ± std). The difference between TFV and ATV was significant (p = 6 × 10⁻¹⁴ by t-test).

