Figure 4.
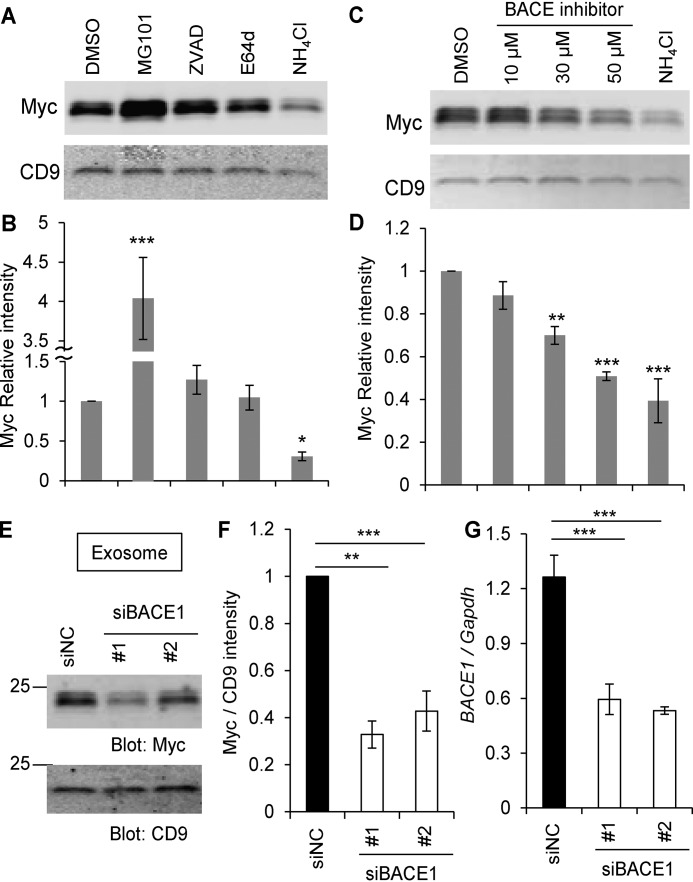
The Nogo-66 loop region on the surface of exosomes. A and B, HEK293T cells were transfected with Nogo-A–Myc. 24 h after transfection, media were changed. DMSO, MG101 (20 μm), Z-VAD-fmk (20 μm), E64d (20 μm), and NH4Cl (20 mm) were added and cultured for further 12 h. Then culture supernatants were collected, and the exosome fraction was immunoblotted with anti-Myc and anti-CD9 antibodies (A). The graph shows Myc intensity divided by CD9 intensity compared to DMSO control (B). Mean ± S.E., n = 5–8 independent experiments. *, p < 0.05; ***, p < 0.005; one-way ANOVA followed by Dunnett's test. C and D, HEK293T cells were transfected with Nogo-A–Myc. 24 h after transfection, media were changed. DMSO, the indicated amounts of BACE inhibitors, and NH4Cl (20 mm) were added and cultured for further 12 h. Then culture supernatants were collected, and the exosome fraction was immunoblotted with anti-Myc and anti-CD9 antibodies (C). The graph shows Myc intensity divided by CD9 intensity compared to DMSO control (D). Mean ± S.E., n = 4 independent experiments. **, p < 0.01; ***, p < 0.005; one-way ANOVA followed by Dunnett's test. E, HEK293T cells were transfected with Nogo-A–Myc and siNC, siBACE1 #1, or siBACE1 #2. Exosomes were purified 36 h after transfection and immunoblotted with anti-Myc and anti-CD9 antibodies. F, quantification of Myc intensity divided by CD9 intensity compared to DMSO control. Mean ± S.E., n = 6 independent experiments. **, p < 0.01; ***, p < 0.005; one-way ANOVA followed by Dunnett's test. G, real-time PCR for replicates of siBACE-transfected HEK293T cells. BACE1 mRNA expression was normalized to Gapdh mRNA expression. Mean ± S.E., n = 4 independent experiments. ***, p < 0.005; one-way ANOVA followed by Dunnett's test.

