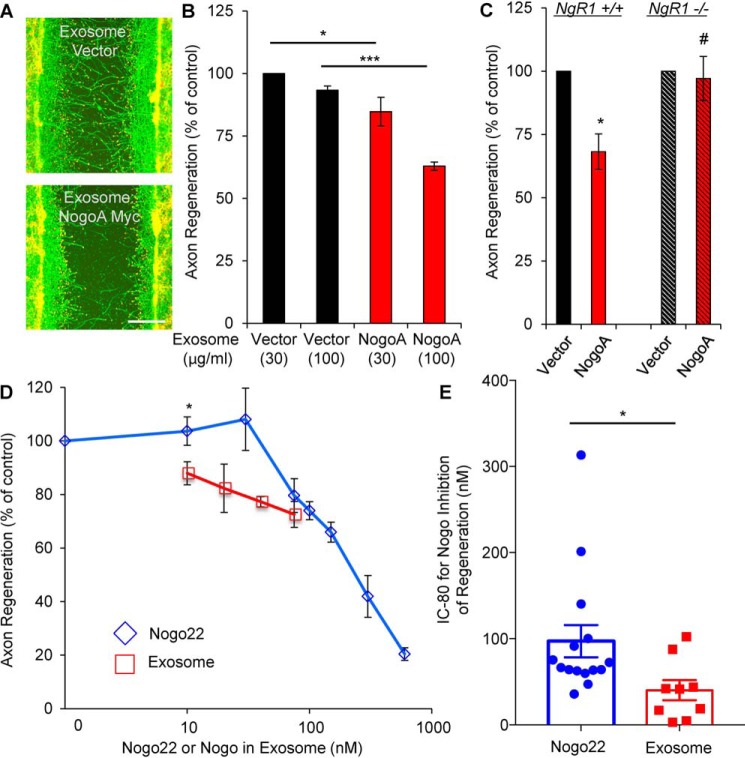
Figure 5.
Inhibitor function of the Nogo-A C-terminal fragment. A and B, cortical neurons were scraped and treated with the indicated amount of exosomes at 8 DIV for 3 days (A). The microphotographs show βIII-tubulin (in axons, green) and phalloidin (to stain F-actin, red). Scale bar = 200 μm. B, quantification of axonal regeneration. Mean ± S.E., n = 3 biological replicates. *, p < 0.05; ***, p < 0.005; one-way ANOVA followed by Tukey's test. C, cortical neurons from the WT or NgR1−/− were scraped and treated with the same amount of exosomes at 8 DIV for 3 days. The graph shows quantification of axon regeneration. *, p < 0.05; Student's two-tailed t test. #, not significant. D, cortical neurons were scraped and treated with exosomes (10, 20, 40, and 75 nm) or Nogo22 (0, 10, 30, 75, 100, 150, 300, and 600 nm) at 8 DIV for 3 days. The graph shows quantification of axonal regeneration. Mean ± S.E., n = 2–6 biological replicates. *, p < 0.05; Student's two-tailed t test. E, the IC80 from each separate experiment was calculated. Mean ± S.E., n = 15 (Nogo22) and n = 9 (exosomes) biological replicates. *, p < 0.05; Student's two-tailed t test.

