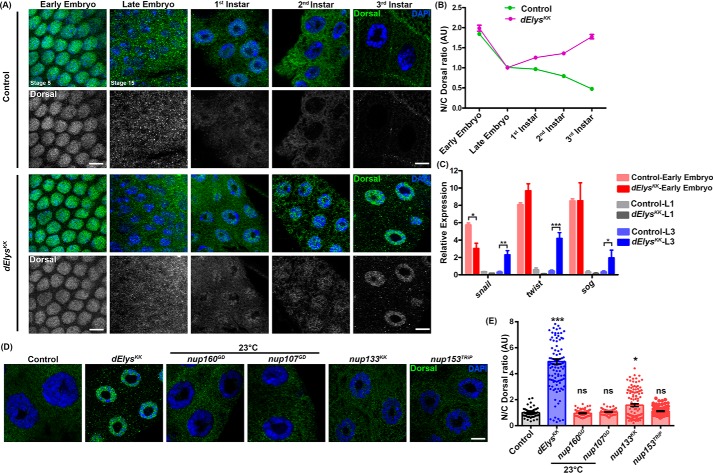
Figure 5.
dElys depletion re-distributes Dorsal in the nucleus during the larval stage and specific to dElys. A, nuclear localization of Dorsal (green) assessed in control and dElys depletion in each stage of development. The 1st two vertical panels show early and late embryonic stages, and the next three vertical panels show each successive larval stage salivary glands. DNA is stained with DAPI. Scale bar, 5 μm. Early embryonic depletion was driven with mat–α-tub–GAL4. Control is WT flies crossed with the mat–α-tub–GAL4 (for early embryos) and ubiquitous Act5C–GAL4 (for late embryo and later developmental stages) driver, respectively. Stages of embryonic development are mentioned. B, quantitation of nuclear/cytoplasmic intensity ratio of Dorsal measured through developmental stages of Drosophila and plotted for each stage showing the distribution of Dorsal in embryos and salivary gland cells. Data represent at least three independent experiments. Data are represented from at least three independent experiments. Error bar represents S.E. C, Dorsal target genes snail, twist, and sog expression was analyzed in successive developmental stages by quantitative-PCR. The red bar represents analysis in whole early embryos; the gray bar represents analysis in head complex tissues of the first instar larva, and the blue bar represents analysis in head complex tissues of third instar larva. Control and dElys depletion graphs are mentioned with different shades in the image. Data are represented from at least three independent experiments. The error bar represents the standard deviation. *** represents p < 0.0001, ** represents p < 0.001, and * represents p < 0.05. D, Dorsal nuclear localization assessed in control and nucleoporin knockdown third instar larval salivary glands (ubiquitous Act5C–GAL4 driven). DNA is stained with DAPI. Scale bar, 5 μm. Control is WT flies crossed with the Act5C–GAL4 driver. RNAi-mediated knockdown of Nup160GD and Nup107GD was carried out at 23 °C to obtain third instar larva. E, quantitation of nuclear/cytoplasmic intensity ratio of Dorsal in control and nucleoporins knockdown salivary gland nuclei (ubiquitous Act5C–GAL4 driven). Data are represented from at least three independent experiments. At least 45 nuclei were analyzed from 7 to 8 pairs of salivary glands. Statistical significance derived from one-way ANOVA followed by Tukey's post hoc test. The error bar is S.E. *** represents p < 0.0001, and * represents p < 0.05; ns is nonsignificant.

