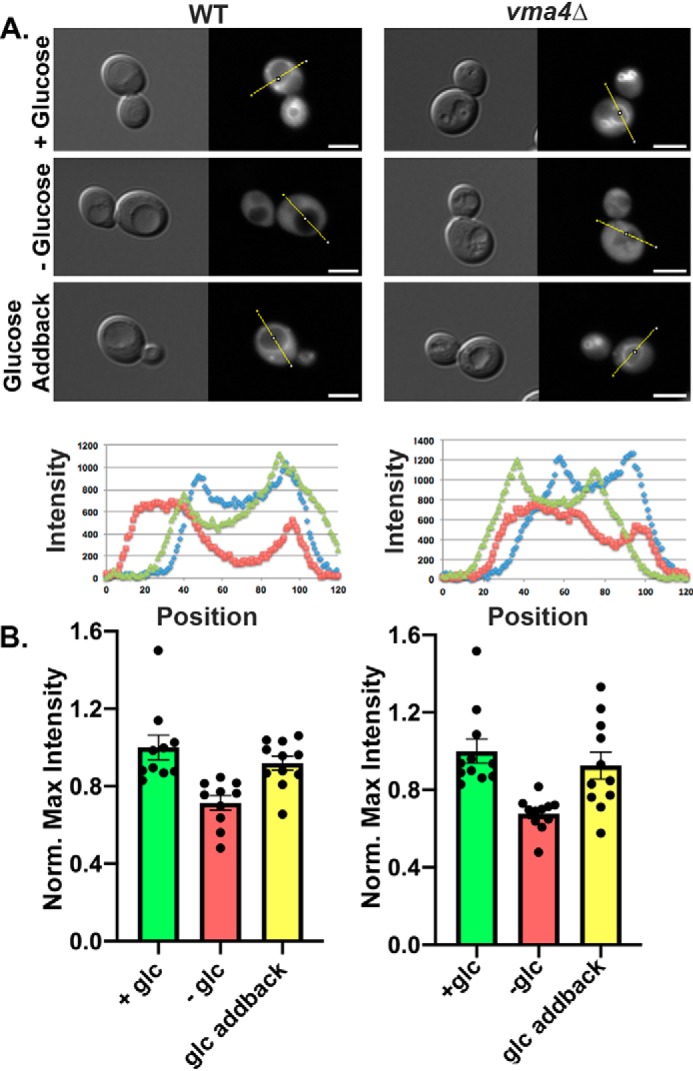
Figure 2.

Glucose-dependent recruitment of RAVE to the vacuolar membrane does not require interaction with the V1 subcomplex. A, DIC and Rav2-GFP images were obtained for WT and vma4Δ cells in the presence of glucose (+Glucose), after 15 min of glucose deprivation (−Glucose), and 15 min after the readdition of glucose to glucose-deprived cells (Glucose Addback). The fluorescence intensities on the lines shown in each GFP image are plotted in the graphs below the micrographs: blue lines for +glucose, red lines for −glucose, and green lines for glucose addback. Scale bar, 5 μm. B, line scans were plotted for 10–11 cells from each condition, and maximum intensities along the line scan are shown, after normalization to the average maximum in the +glucose sample for each strain. Bars, mean ± S.E. (error bars); individual data points are also shown.
