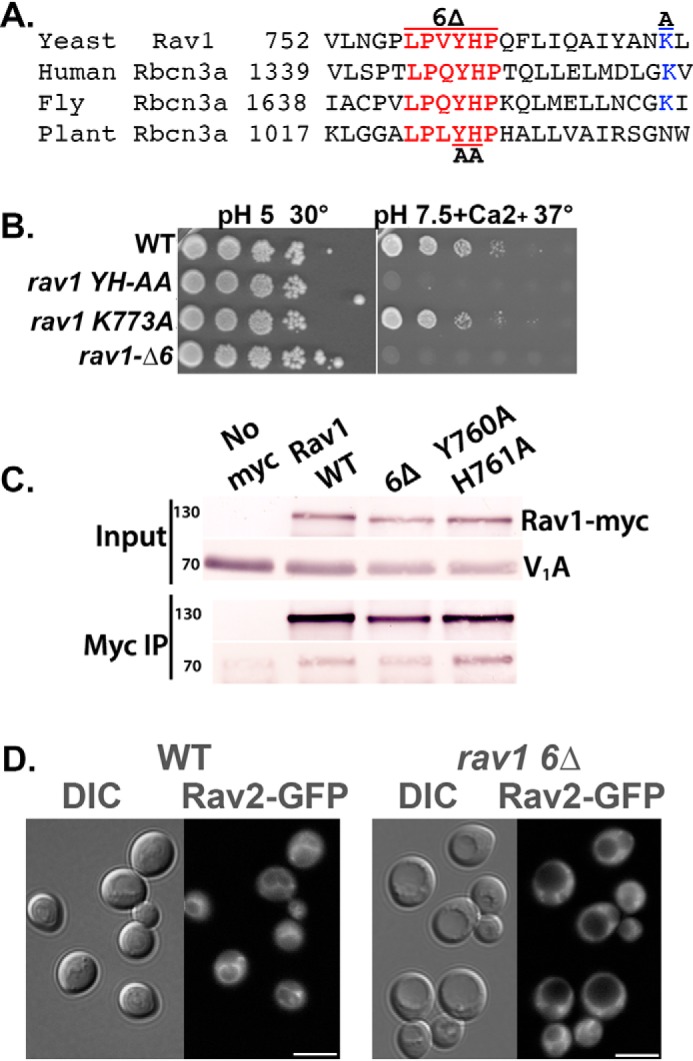
Figure 4.

Mutations in a conserved sequence of Rav1 generate a Rav1− growth phenotype and compromise RAVE recruitment to the membrane. A, alignment of the indicated portion of yeast Rav1 with the following rabconnectin-3α homologues in higher eukaryotes: human, Homo sapiens DMXL2 (NCBI locus AAI44540); fly, Drosophila melanogaster rabconnectin-3α (NCBI locus NP_572302); and plant, Arabidopsis thaliana hypothetical protein (NCBI locus AAD20167). Numbers indicate the position of the first amino acid in the protein sequence shown. B, growth phenotype of strains containing WT and mutant RAV1. 10-Fold serial dilutions of log-phase liquid cultures of the indicated strains grown in YEPD, pH 5, were prepared in 96-well plates and then transferred by pinning to YEPD, pH 5, plates or YEPD, pH 7.5, plates containing 60 mm CaCl2. For each plate, the highest concentration of cells is shown on the left, with successive serial dilutions to the right. Growth at 30 °C and 37 °C as indicated. The Rav− mutant phenotype is characterized by sensitivity to high pH and calcium concentrations at 37 °C. C, a C-terminal Myc13 tag was added to Rav1 in all of the strains except the no-Myc control samples (No myc). Cytosolic fractions were prepared from the indicated yeast strains as described under “Experimental procedures,” and a portion was reserved as input. The remainder was combined with mouse anti-Myc mAb followed by Protein A-Sepharose to immunoprecipitate Myc-tagged Rav1 (Myc IP). Both input and immunoprecipitate samples from each strain were separated by SDS-PAGE and transferred to nitrocellulose. The blots were probed was anti-Myc to determine the levels of Rav1-Myc and with mAb 8B1F3 to determine the level of co-precipitated V1A subunit. D, cellular distribution of Rav2-GFP in WT cells and in the rav1 6Δ mutant. DIC images are shown to the left of each set and GFP fluorescence to the right. Scale bar, 5 μm.
