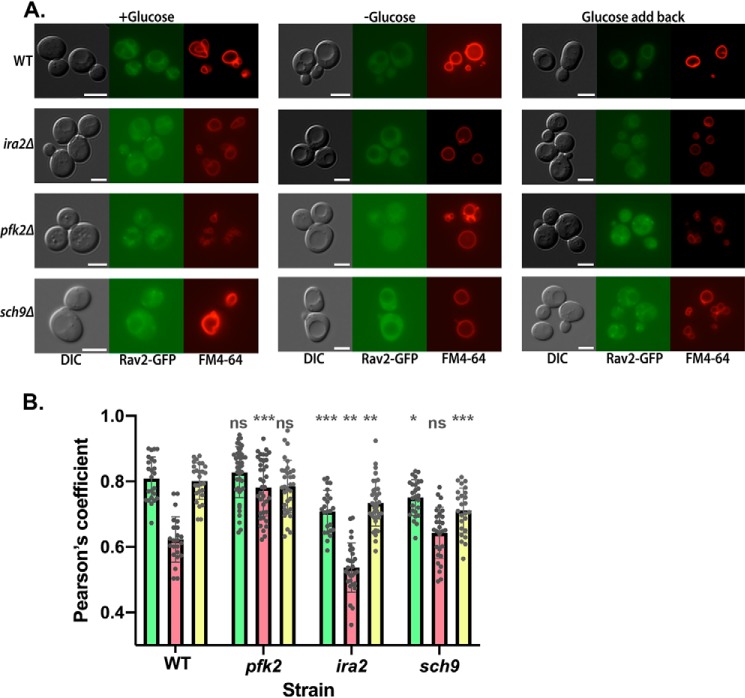
Figure 7.
Glucose-dependent localization of RAVE to the vacuolar membrane in mutants. A, Rav2 was tagged with GFP in the indicated WT and mutant cells. Cells at log phase were labeled with FM4-64 and subjected to a 90-min chase to allow transport of the dye to the vacuole. Each strain was visualized from the glucose growth medium (+Glucose), after a 15-min glucose deprivation (−Glucose) and 15 min after glucose readdition (Glucose add back). For each strain and condition, the same field was visualized under DIC (left), GFP fluorescence (middle), and Texas Red fluorescence (right) optics. Scale bar, 5 μm for all images. Images shown are representative of at least 50 cells imaged from at least two separate experiments. B, Pearson coefficient for colocalization of Rav2-GFP and FM4-64 was calculated for 24–40 cells for each strain and condition, obtained from at least two different experiments. For each strain, individual measurements are superimposed on bars corresponding to the mean Pearson coefficient for glucose-grown cells (green), −glucose cells (red), and glucose addback (yellow). Error bars, S.D. For each condition, the four strains were compared by one-way analysis of variance, and significant differences from the WT strain are indicated: ***, p < 0.0005; **, p < 0.005; *, p < 0.05; ns, p > 0.05.

