Figure 4.

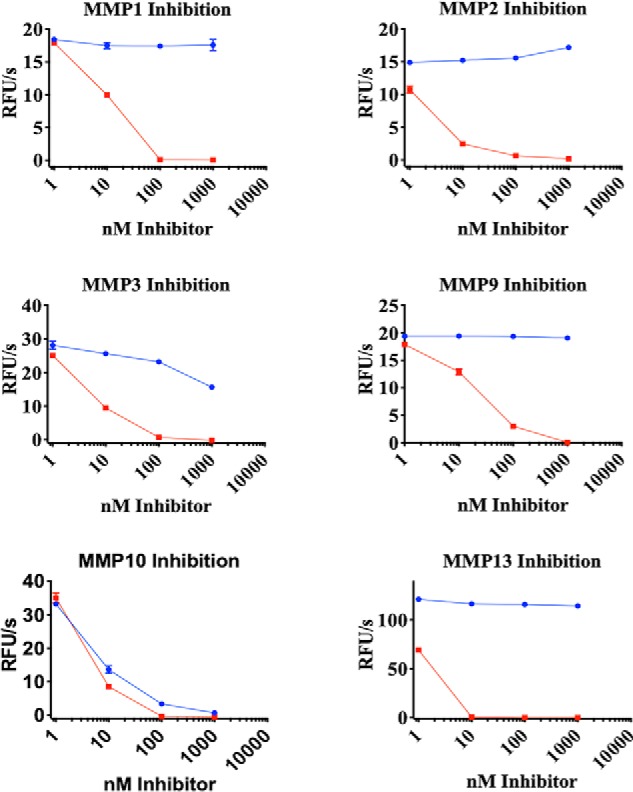
H3 selectivity toward MMP10. H3 (blue) and TIMP1 (red) were titrated against the indicated MMPs. Activity was monitored using a fluorescence plate reader. Error bars, S.D.; n = 3. RFU, relative fluorescence units.

H3 selectivity toward MMP10. H3 (blue) and TIMP1 (red) were titrated against the indicated MMPs. Activity was monitored using a fluorescence plate reader. Error bars, S.D.; n = 3. RFU, relative fluorescence units.