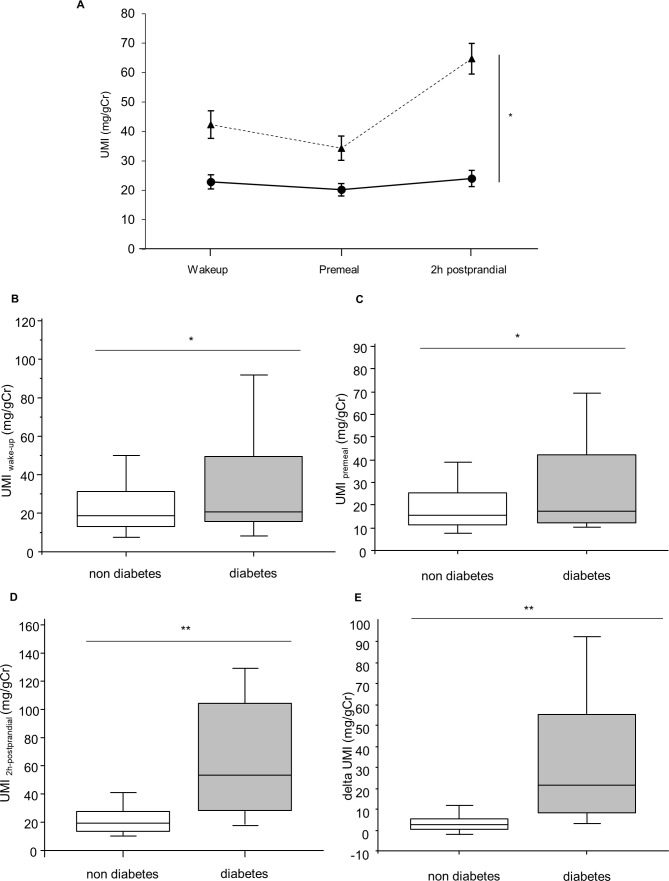
Figure 2.
Comparison of UMI between subjects with or without diabetes during ingestion of test meal. (A) Solid line: subjects without diabetes (n=92); dotted line: subjects with diabetes (n=23). Error bars represent SE *p<0.001 computed by repeated-measures ANOVA. (B–E) Box plots indicating the 5th and 95th percentiles (vertical lines), 25th and 75th (boxes), and 50th percentiles (horizontal lines). *P<0.05 and **p<0.0001 computed by Mann-Whitney test. UMIwake-up, UMI at wake-up time; UMIpremeal, UMI at premeal; UMI2h-postprandial, UMI at 2-hour postprandial; ΔUMI, UMI2h-postprandial minus UMIpremeal. ANOVA, analysis of variance; UMI, urinary myoinositol.

