Figure 1.
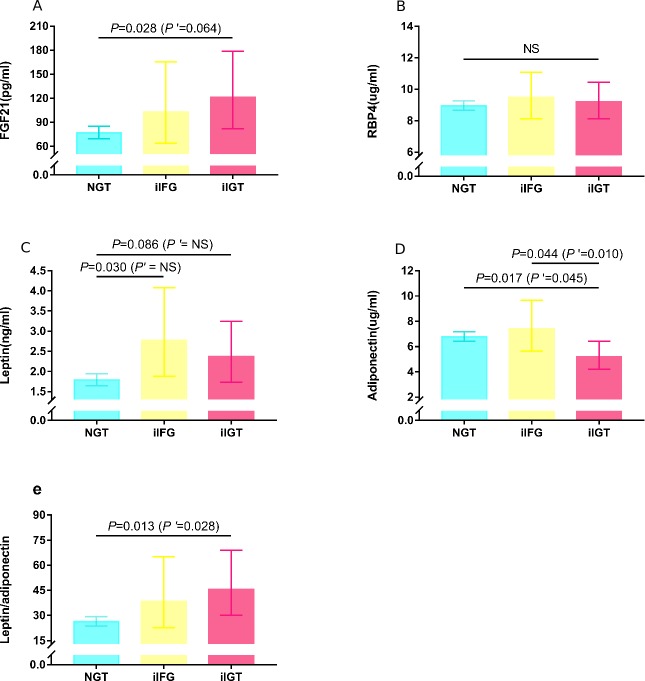
Figure 1Comparison of adipokine levels among the three groups. Data were presented as geometric mean (95% CI) and calculated from the general linear regression model with post hoc comparisons after controlling for age and gender. P’ values were further adjusted for BMI. Only p values of <0.10 were represented. (A) The iIGT group had higher FGF21 levels than the NGT group, and the difference was attenuated with further adjustment for BMI. (B) RBP4 levels were not significantly different (NS) among the three groups. (C) The difference in leptin levels among the three groups was ablated after controlling for BMI. (D) The iIFG group was associated with decreased adiponectin levels compared with NGT and iIFG. (E) The iIGT group was associated with increased leptin/adiponectin compared with the NGT group. FGF21, fibroblast growth factor 21; iIFG, isolated impaired fasting glucose; iIGT, isolated impaired glucose tolerance; NGT, normal glucose tolerance; NS, not significant; RBP4, retinol binding protein 4.

