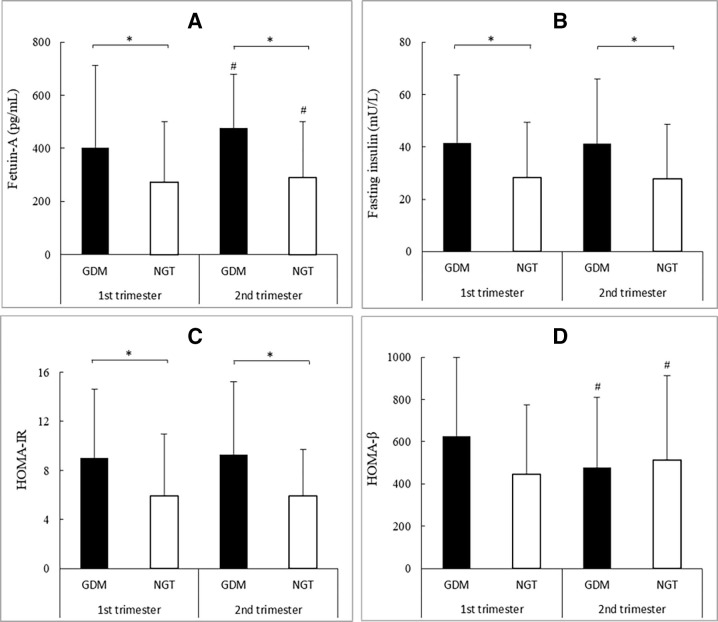
Figure 1.
Fetuin-A (A), fasting insulin (B), HOMA-IR (C), and HOMA-β (D) levels in the first and the second trimesters. Data were presented as medians (IQR). *P< 0.05. #P<0.05 versus first trimester in the same group. GDM, gestational diabetes mellitus; HOMA-IR, homeostasis model assessment of insulin resistance; NGT, normal glucose tolerance.

