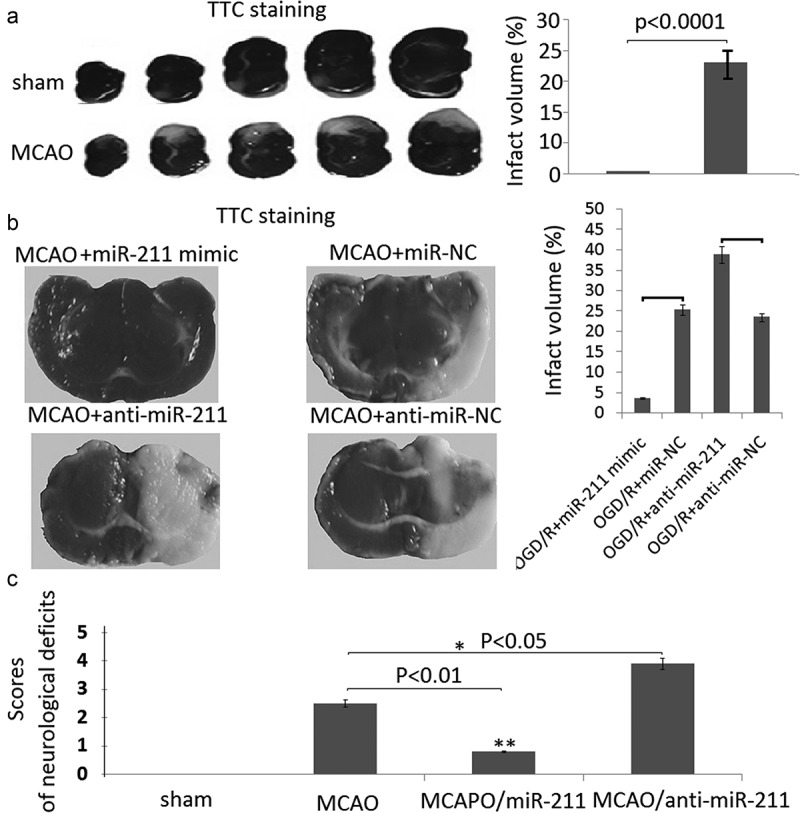
Figure 4.

MiR-211 attenuated infarction volumes in MCAO brain. A, TTC staining of representative coronal sections after untreated MCAO. The relative infarct area percentage was evaluated by observing the unstained infarcted tissue zone (white) and the stained normal tissue zone (red). B,TTC staining of representative coronal sections after miR-211 mimic or anti-miR-211 treated MCAO. The relative infarct area percentage was evaluated by observing the unstained infarcted tissue zone (white) and the stained normal tissue zone (red). C, Neurological deficit scores with analysis of variances followed by the Bonferroni/Dunn post hoc test).*P < 0.05;**P < 0.01.
