
Figure 1.
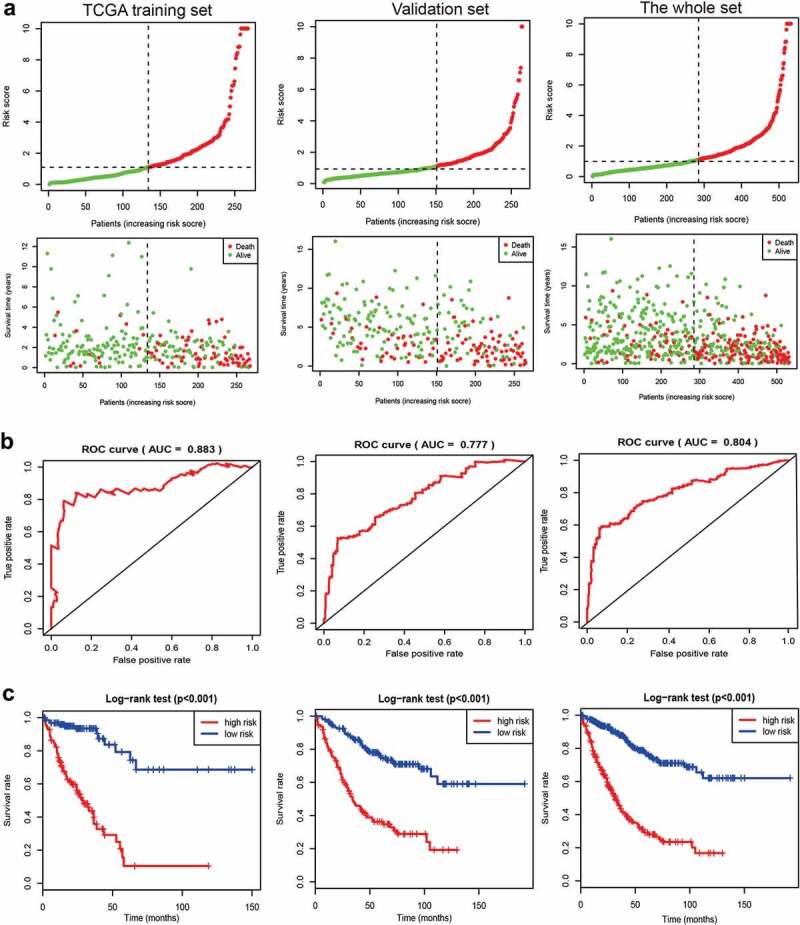
A 15-gene prognostic risk signature in advanced colorectal cancer (CRC) for a TCGA training set, a validation set, and the whole set. (a) Samples sorted by risk score and the corresponding survival status. (b) ROC curve of the 15-gene prognostic risk signature. (c) The Kaplan–Meier curves of the 15-gene prognostic risk signature (the high- and low-risk groups). TCGA: The Cancer Genome Atlas; ROC: the receiver operating characteristic curve; AUC: area under the curve.