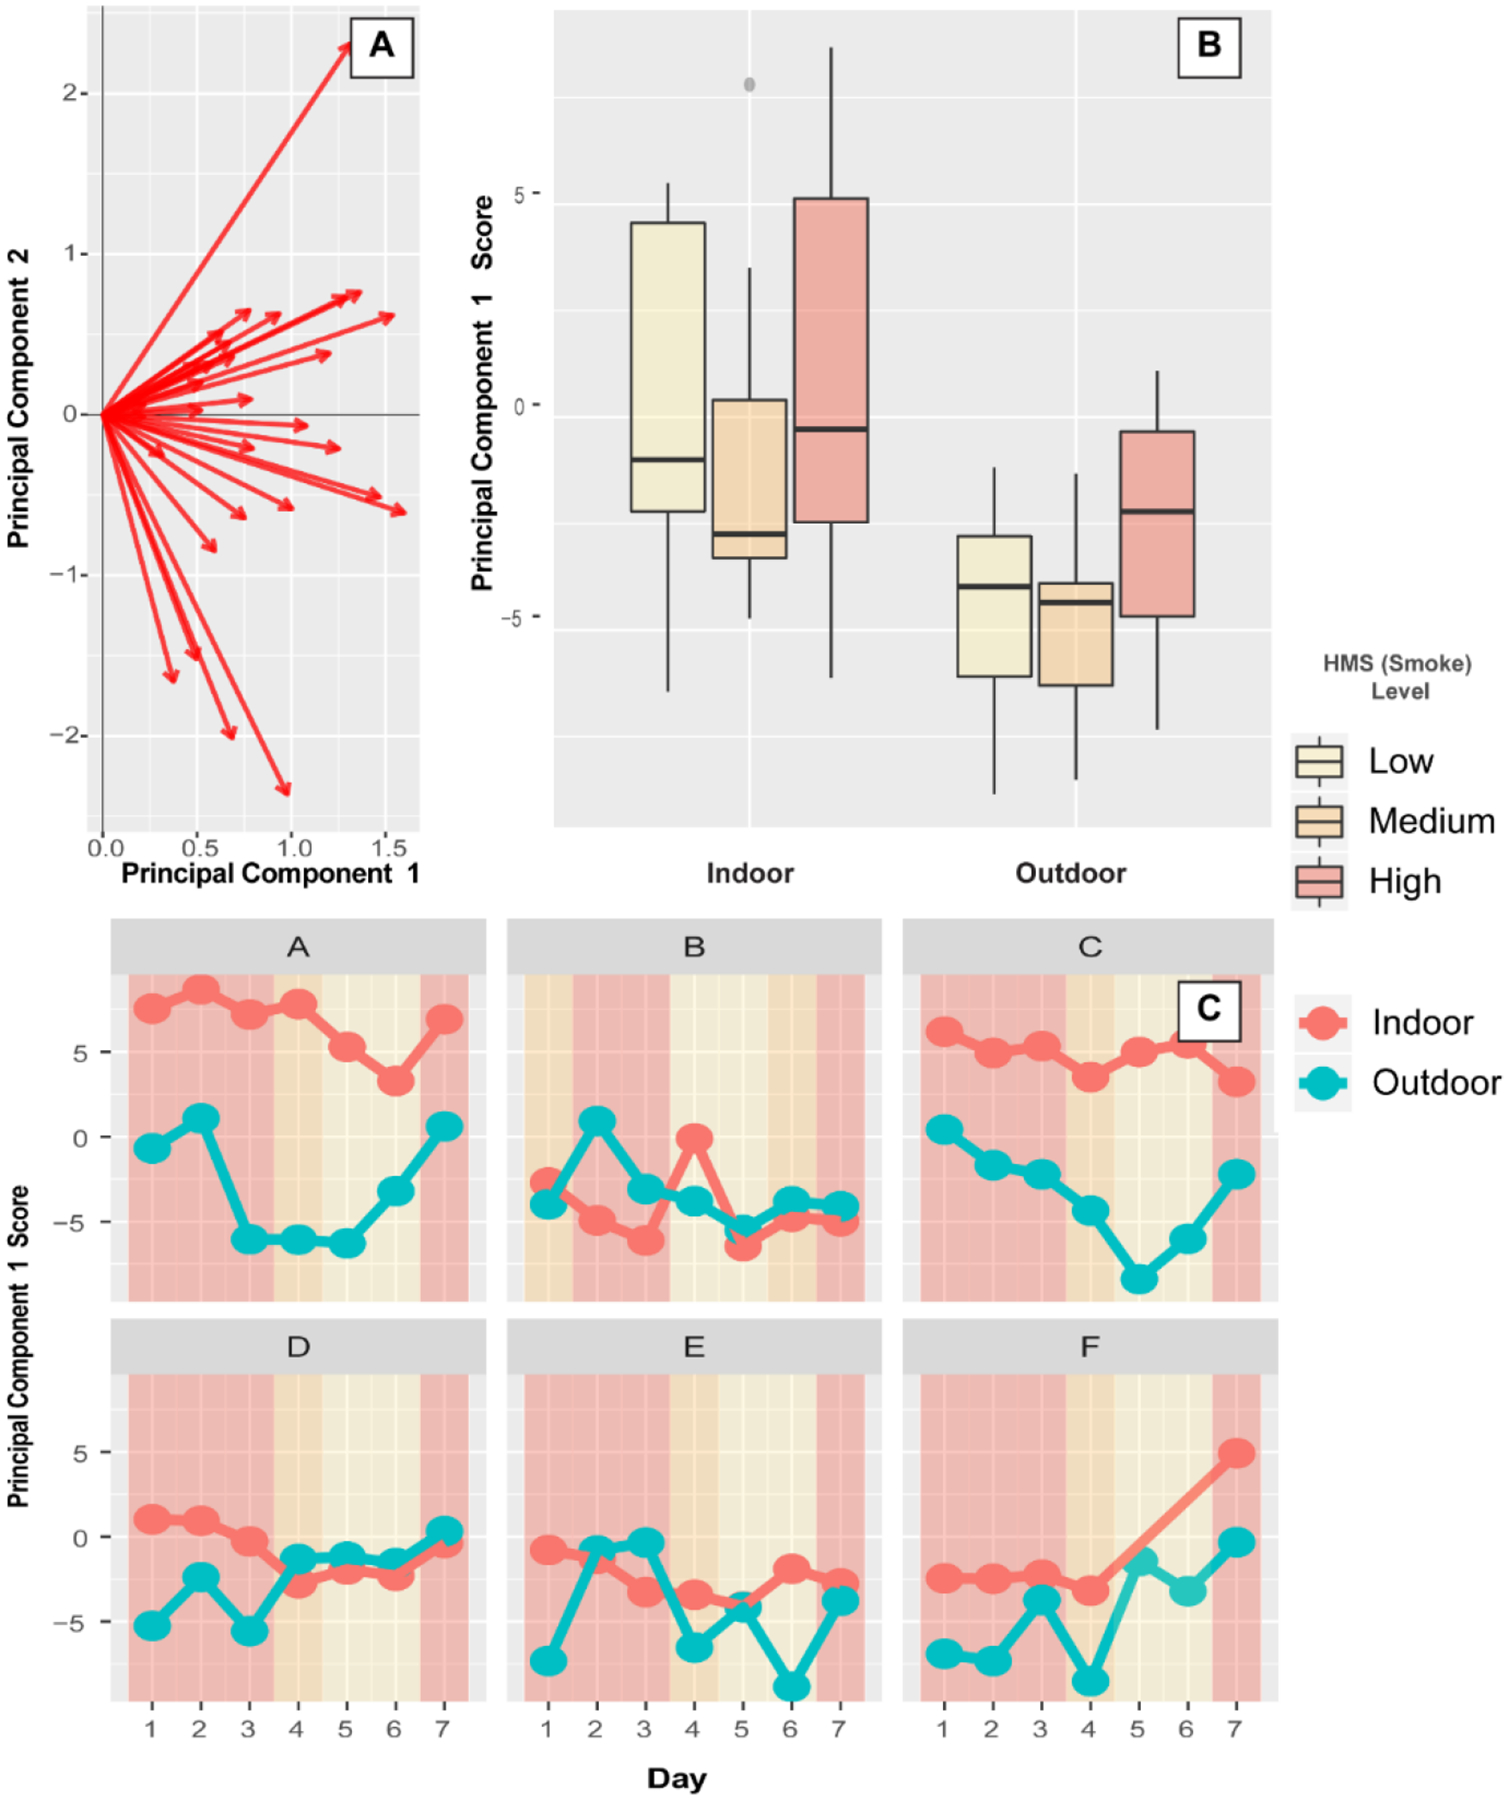
Figure 4. Principal Component Boxplot and Time Series by Indoor/Outdoor Environment and Wildfire Impact.

(A) The probabilistic principal component 1 and 2 loadings. All but 3 loadings for component are positive indicating a positive correlation between the majority of PAHs. This allows for an easy interpretation of principal component score 1 as an aggregate measure of all PAHs. (B) Boxplot of principal component 1 score versus indoor/outdoor and by the 3 levels of wildfire smoke measured in the NOAA Hazard Mapping System (shaded colors). (C) A time series plot of principal component 1 scores by day (24 h integrated samples) and by indoor/outdoor environment. The same colors in B, showing the hazard mapping system level, are displayed as the background color.
