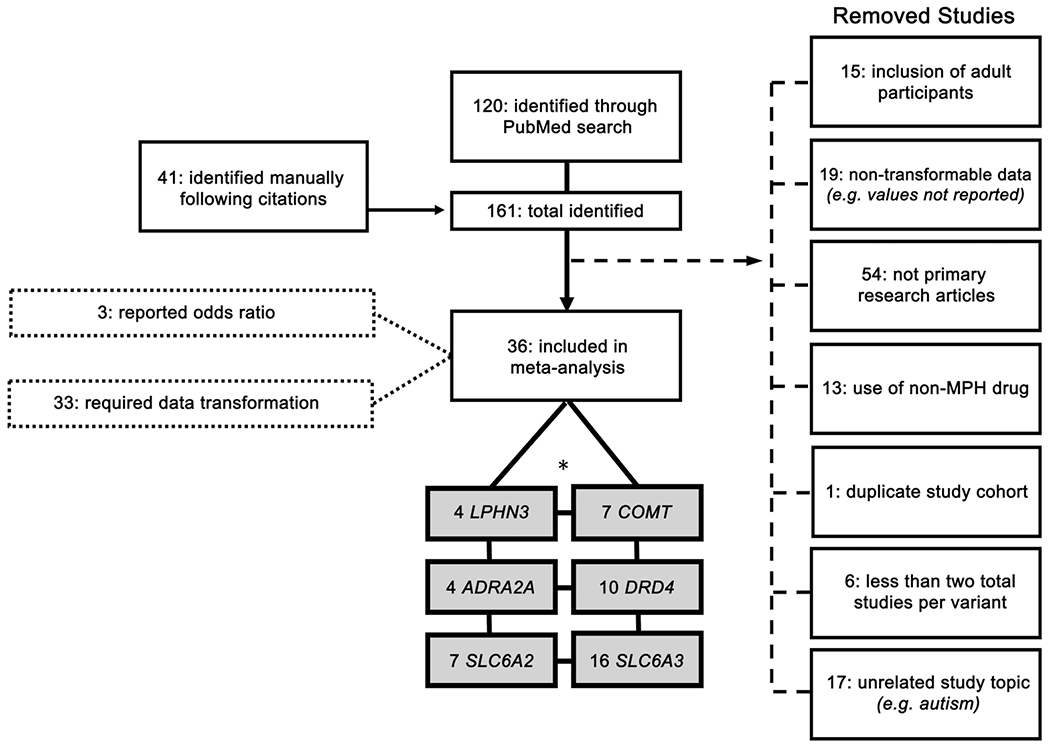
Figure 1.

Flow chart of study inclusion. Diagram depicts the systematic search progression used in this study. Boxes attached to the body of the diagram by a dashed line represent removed studies. Boxes attached to the body of the diagram by dotted lines represent data-input methods. Grayed boxes indicate included studies. *The six genes chosen for further meta-analysis exceed 36 (represented in diagram as ‘36 included in further analysis’) because some studies included more than one gene and/or genetic variant.
