
Figure 2. CD74 and MHCII cell-surface levels in HCMV- infected monocytes inversely-correlate with viral transcript levels.
(A) HCMV- infected monocytes were FACS sorted according to cell-surface levels of CD74 or MHCII, at 3dpi. High and low gates were determined as highest and lowest 30% of the population, respectively. (B and C) Relative expression level of the viral transcripts RNA2.7 and UL138 (B) or MHCII and CD74 transcripts (C), as measured by RT-qPCR in HCMV- infected cells, sorted by either MHCII (left) or CD74 (right) cell-surface levels at 3dpi. (D) Relative abundance of viral DNA in HCMV- infected CD74high and CD74low monocytes, at 3dpi as measured by qPCR. Graphs show a representative experiment of 3 biological repeats, error bars reflect standard deviation of 3 measurements. P values as calculated by t-test are indicated.

Figure 2—figure supplement 1. CD74 and MHCII cell-surface levels in HCMV- infected monocytes inversely-correlate with viral transcript levels.

HCMV- infected monocytes were FACS sorted according to cell-surface levels of (A) MHCII or (B) CD74, at 3dpi. High and low gates were determined as highest and lowest 30% of the population, respectively. Two biological repeats are shown. Viral expression levels in cells from each gate were assessed by RT-qPCR measurement of the viral transcript RNA2.7. Error bars reflect standard deviation of 3 measurements. P values as calculated by t-test are indicated.
Figure 2—figure supplement 2. Cell-surface CD74 levels in HCMV- infected monocytes at 6dpi inversely-correlate with viral gene expression.
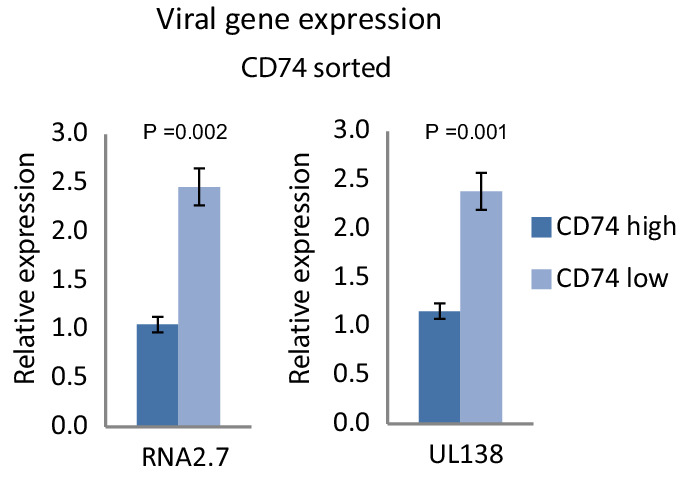
Expression level of viral transcripts RNA2.7 and UL138, as RT-qPCR measured in HCMV- infected cells, sorted by CD74 cell-surface levels at 6dpi. Error bars reflect standard deviation of 3 technical replicates. P values, as calculated by t-test, are indicated.
Figure 2—figure supplement 3. CD74 and MHCII genes are co-expressed in HCMV- infected monocytes.

Scatterplot showing read number of CD74 vs.read number of MHCII genes in single HCMV- infected monocytes according to scRNA-seq data (Shnayder et al., 2018).
Figure 2—figure supplement 4. Surface expression distribution of CD74 does not change in uninfected and infected cell populations.

Infected (green) and uninfected (gray) cells were stained for surface expression of CD74 and analyzed by flow cytometry at 0, 3 and 6dpi.