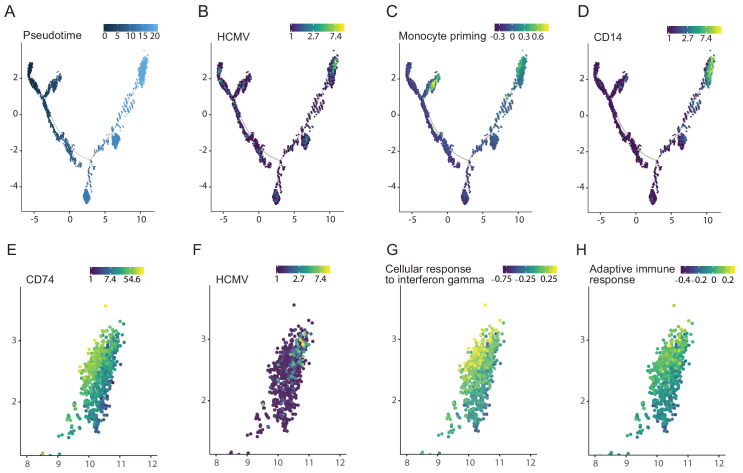
Figure 8. Viral transcript levels in HCMV-infected CD34+ HSPCs is associated with priming towards the monocyte lineage and with reduced immune-response.
Pseudotime trajectory of single cell transcriptomes from HCMV- infected CD34+ HSPCs (n = 7,634, Shnayder et al., 2018) colored by pseudotime (A), viral transcript levels (B), expression of monocyte priming gene signature (Velten et al., 2017) (C) and CD14 expression (D). Zoom-in representation of the pseudotime trajectory in A-D, on the region exhibiting higher viral transcript level (top right group of cells), colored by expression of CD74 (E), viral transcript levels (F), expression level of the cellular response to interferon gamma pathways (G) and of the adaptive immune response pathway (H).

