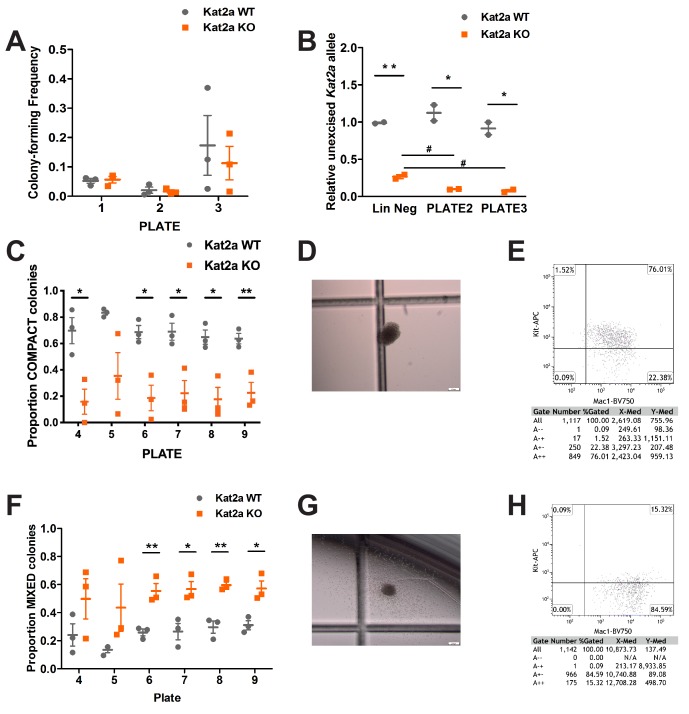
Figure 1. Conditional knockout of Kat2a promotes differentiation of MLL-AF9-transformed cells in vitro.
(A) Serial re-plating of colony-forming cell (CFC) assays of MLL-AF9 transformed cells, mean ± SEM, n = 3. (B) Excision efficiency was evaluated by qPCR during re-plating of MLL-AF9 transformed cells, mean ± SEM, n = 2–3, *p<0.01 and **p<0.001. (C) Proportion of Compact-type colonies in MLL-AF9 transformed cells on Kat2a WT or KO background, mean ± SEM, n = 3, *p<0.01 and **p<0.001. (D) Representative photograph of a Compact-type colony. (E) Flow cytometry analysis of the colony in (D). (F) Proportion of Mixed-type colonies in MLL-AF9 transformed cells on Kat2a WT or KO background, mean ± SEM, n = 3, *p<0.01 and **p<0.001. (G) Representative photograph of a Mixed-type colony. (H) Flow cytometry analysis of the colony in (G). Two-tailed t-test was performed in (A), (B), (C) and (F).


