. 2020 Jan 27;9:e51754. doi: 10.7554/eLife.51754

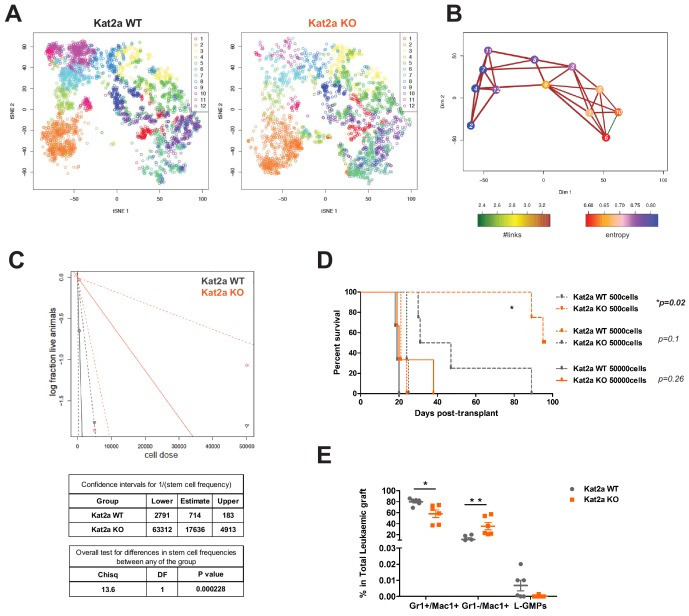
Figure 4. Kat2a loss depletes functional MLL-AF9 leukemia stem-like cells.

(A) t-SNE plot of single-cell RNA-seq data for Kat2a WT (left) and KO (right) primary leukemic cells. RACE-ID K-means clustering was used to classify cells from Kat2a WT and KO primary leukemias in combination, on the basis of the expression of the most highly variable genes from each genotype as defined in Figure 2D. Clusters are color-coded and cells of each genotype were displayed separately for easier appreciation of their non-overlapping transcriptional spaces. (B) STEM-ID trajectory plot of analysis in (A) representing combined measures of information entropy and cluster connectivity strength; clusters as in (A). (C) Extreme Limiting Dilution Analysis (ELDA Hu and Smyth, 2009) of leukemia-initiating cell frequency in Kat2a WT and KO primary leukemias. Primary leukemias of each genotype were pooled (WT-5; KO-4) and transplanted as 50K, 5K and 500 cell doses into 3–4 animals/dose group. (D) Survival curve of secondary recipients of MLL-AF9 leukemic cells from Kat2a WT and KO backgrounds; data as in (C). Log rank test for difference in survival, n = 3–4/per dose group. 50 K cells p=0.26, 5 K cells p=0.1, 500 cells p=0.02. (E) Flow cytometry analysis of BM cells from secondary Kat2a WT and KO leukemia transplant recipients (50K and 5 K cells). Cell compartments as in Figure 2C; n = 6; mean ± SEM, 2-tailed t-test, **p<0.001, *p<0.01, and L-GMPs p=0.07.

Figure 4—source code 1. tSNE plot of single-cell RNA-seq data - R-language code and individual cell coordinates with respective cluster ID, source code for Figure 4A.

Figure 4.

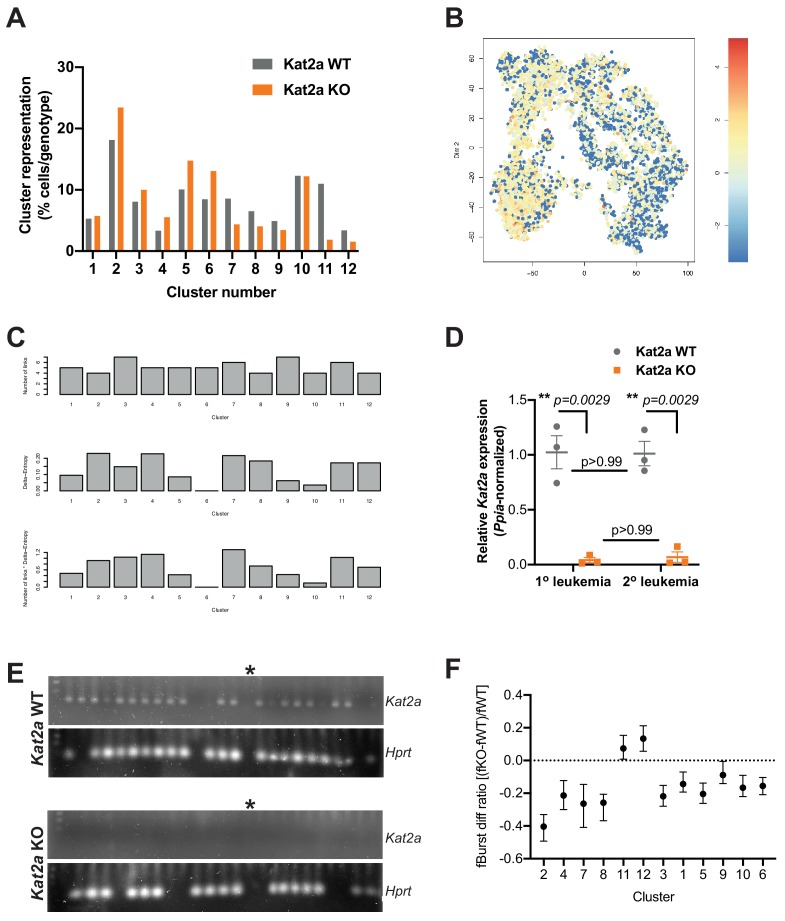
Figure 4—figure supplement 1. Kat2a WT and KO MLL-AF9 primary leukemias have distinct cluster composition and organization.

Figure 4—figure supplement 1.

(A) Relative representation of Kat2a WT and KO cells in RACE-ID clusters of primary MLL-AF9 leukemia. (B) Expression of an MLL-associated self-renewal gene signature in individual cells along the global MLL-AF9 STEM-ID pseudo-time trajectory. Trajectory representation as in Figure 4A, with both genotypes in the same plot. Gene signature defined as per the representation of gene set GCM_MLL (MSigDB) in the Robust geneset. (C) STEM-ID parameters of connectivity (top), entropy (middle) and stemness score (bottom) in MLL-AF9 primary leukemia clusters represented in Figure 4B. The cluster stemness score is the product of the cluster entropy measure and number of links for the cluster in the network; cluster seven has the highest stemness score. (D) Quantitative RT-PCR analysis of Kat2a expression in primary (as per Figure 2B) and secondary MLL-AF9 leukemias of Kat2a WT and Kat2a KO genotypes. Primers and probe used assay exons 6 and 7, within the excised genomic region. N = 3 individual leukemias per genotype and time-point; mean ± SEM; 2-tailed t-test at significant p<0.05. (E) Representative gel electrophoresis of nested single-cell RT-PCR analysis of Kat2a expression in Lin-Kit+Sca-CD16/32+ cells obtained from secondary MLL-AF9 leukemias initiated with Kat2a WT (top) or KO (bottom) cells. Total = 88 Lin-Kit+Sca-CD16/32+ cells/genotype, two different leukemias each; detection frequency of Hprt in duplex was 83% (Kat2a WT) and 76% (Kat2a KO); * no-template control lane. We analyzed a total of 176 cells, including Lin-Kit+Sca-CD16/32+ and Lin-Kit+ cells, and observed 9% Kat2a-expressing Hprt+ KO cells (84% in WT), all of which in the Kit- population. (F) Differential burst frequency between Kat2a KO and WT primary MLL-AF9 leukemia cells in individual clusters along the STEM-ID trajectory presented in the main text Figure 4B.
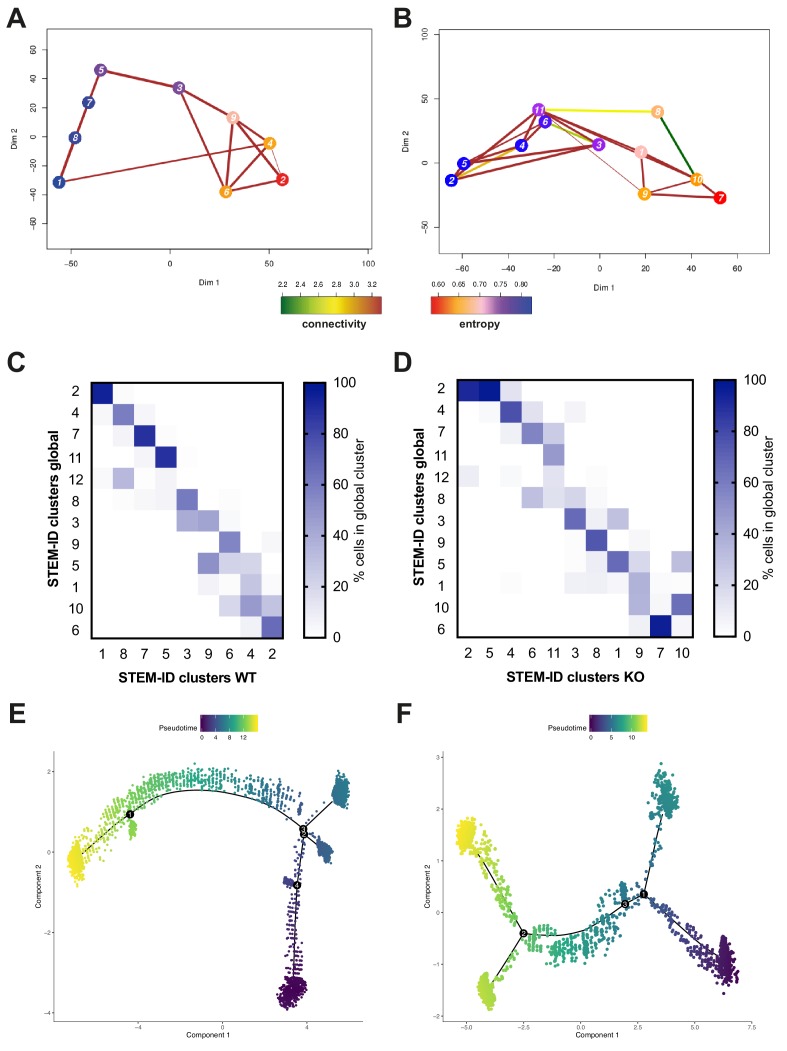
Figure 4—figure supplement 2. Kat2a WT and KO MLL-AF9 primary leukemias have unique differentiation trajectories.

Figure 4—figure supplement 2.

(A–B) STEM-ID trajectory plots of (A) Kat2a WT and (B) Kat2a KO leukemia cells representing combined measures of information entropy and cluster connectivity strength. (C–D) Relative representation of global STEM-ID clusters (Figure 4B) within (C) Kat2a WT-specific and (D) Kat2a KO-specific STEM-ID clusters, as per trajectories in (A) and (B), respectively. (E–F) Monocle pseudo-time trajectories of (E) Kat2a WT and (F) Kat2a KO leukemia cells. Cell identities at the stem-like and differentiated-like end states of STEM-ID (A–B) and Monocle (E–F) genotype-specific pseudo-time alignments were compared, with 67.8% overlap (range 39.8–88.4%) between methods.