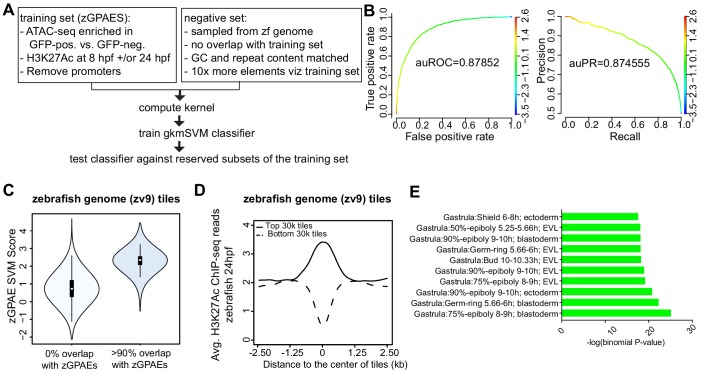
Figure 3. Training a gapped kmer support vector machine (gkmSVM) classifier trained on zGPAEs.
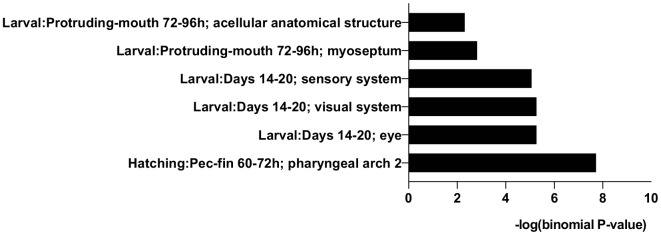
(A) Pipeline for training and cross-validation of gkmSVM classifier on zebrafish periderm enhancer candidates. (B) Receiver Operating Characteristic (ROC) and Precision-Recall (PR) curves using the gkmSVM trained on zGPAEs. au, area under. Color of curves corresponds to SVM scores. (C) Violin plots showing SVM scores of zebrafish genome tiles with 0% or at least 90% overlapped with the training set (GPAEs). (D) Average H3K27Ac ChIP-seq reads at the 30,000 elements with the highest or lowest scores from the gkmSVM trained on zGPAEs. (E) GO enrichment assay for genes associated with the top-scoring tiles 10,000 tilesincluding those that overlap the training set.


