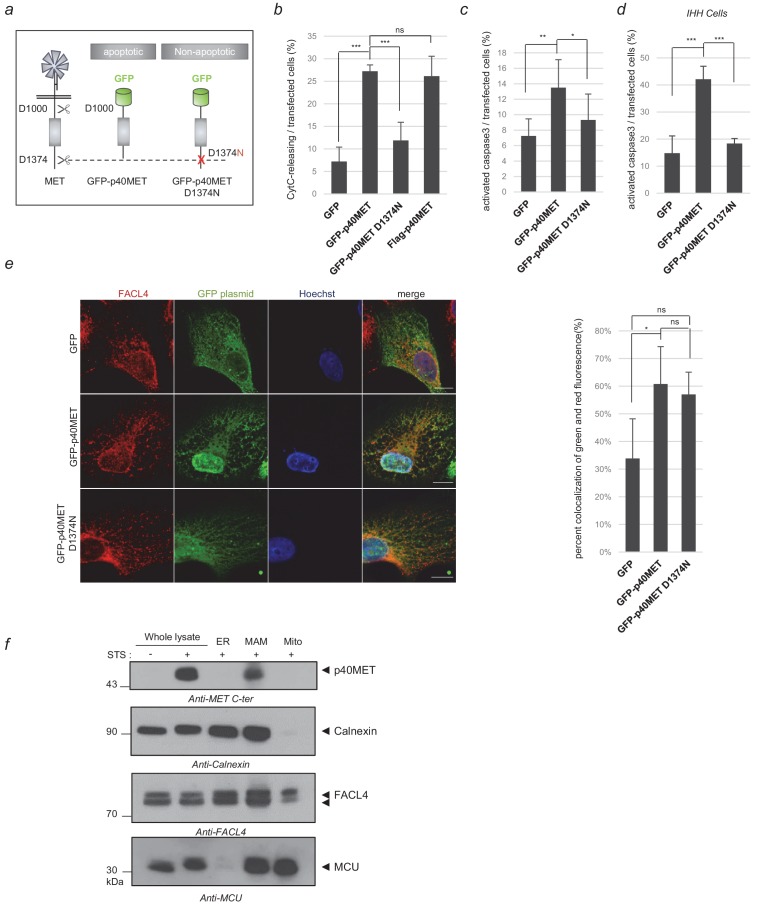
Figure 1. Locating the p40MET fragment by immunofluorescence and subcellular fractionation.
(a) Schematic representation of MET receptor cleavage by caspase during apoptosis, with besides representation of the GFP-p40MET fragment and of the GFP-p40MET D1374N fragment which still possesses the C-terminal tail. (b, c, d) MCF10A (b–c) or IHH (d) cells were transiently transfected with a vector expressing GFP, GFP-p40MET, GFP-p40MET D1374N, or flag-p40MET. After 24 hr transfection for MCF10A and 48 hr for IHH, the cells were fixed and labeled with an appropriate antibody: anti-flag when transfected with the vector expressing flag-p40MET, anti-cytochrome C or anti-cleaved caspase 3 antibody to evaluate apoptosis. The percentage of cytochrome C release or of cleaved-caspase-3-positive cells was determined with respect to the number of GFP- or flag-positive cells. At least 150 cells per well (n = 6;± S.D.) (b), 200 cells per well (n = 6;± S.D.) (c) and 60 cells per well (n = 4;± S.D.) (d) were counted. (e) MCF10A epithelial cells were transfected with a vector expressing GFP, GFP-p40MET, or GFP-p40MET D1374N. Twenty-four hours after transfection, the nuclei were stained with Hoechst (blue staining) and immunofluorescence staining was performed with anti-FACL4 to label the MAMs (red staining). Cells were observed by fluorescence confocal microscopy. Weighted colocalization coefficients were determined by means of Manders coefficients for green staining (of GFP, GFP-p40MET, or GFP-p40MET D1374N) and FACL4 staining (red) on the basis of the fluorescence confocal microscopy images (n = 30;±S.D.). (f) MCF10A cells were starved overnight and treated for 4 hr with 1 µM staurosporine (STS). After treatment, the cells were fractionated into ER, MAM and mitochondrial fractions. Proteins from whole-cell lysates (50 µg) and from the different fractions (20 µg) were analyzed by western blotting with antibodies against the MET kinase domain, the reticular protein calnexin, the MAM protein FACL4, and the inner mitochondrial membrane protein MCU. The positions of prestained molecular weight markers are indicated. Arrows indicate the positions of p40MET, calnexin, FACL4 and MCU; scale bar = 10 µm, ns, nonsignificant; *, p<0.05; **, p<0.01; ***, p<0.001 as determined by Student’s t test.
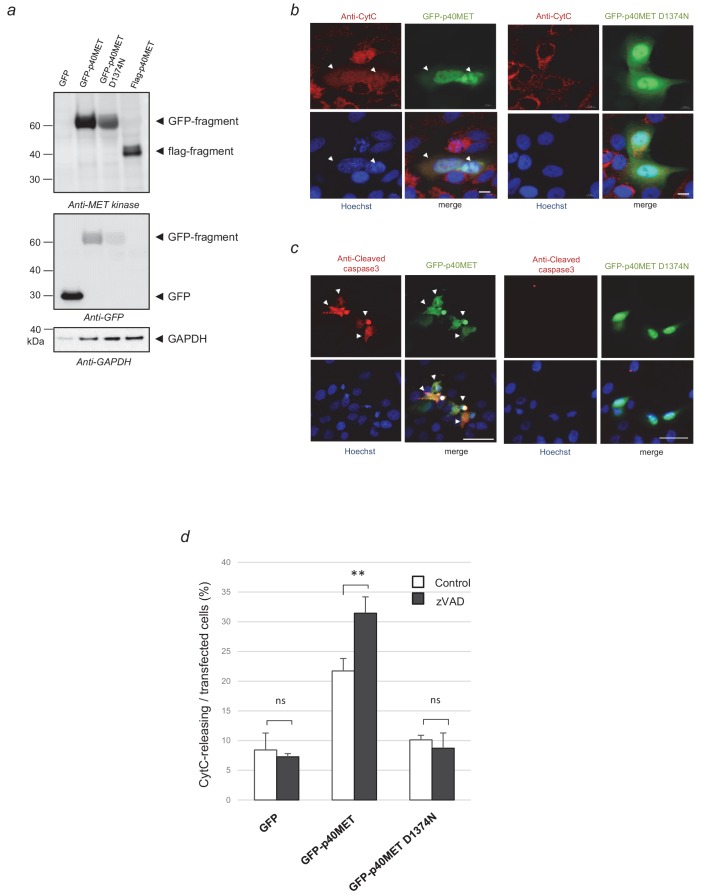
Figure 1—figure supplement 1. Validation of the vectors expressing GFP-p40MET and GFP-p40MET D1374N.
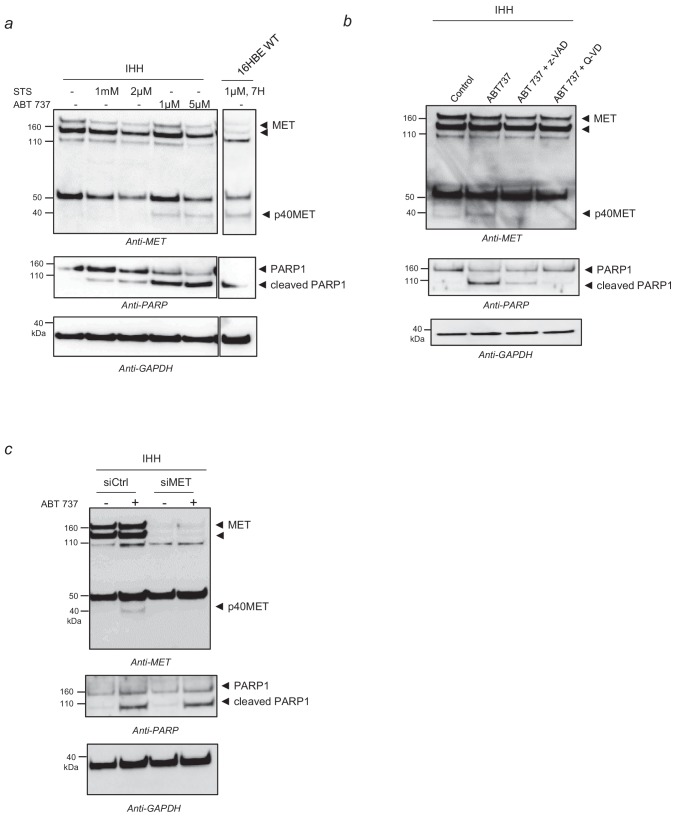
Figure 1—figure supplement 2. p40MET fragment generation in IHH cells.
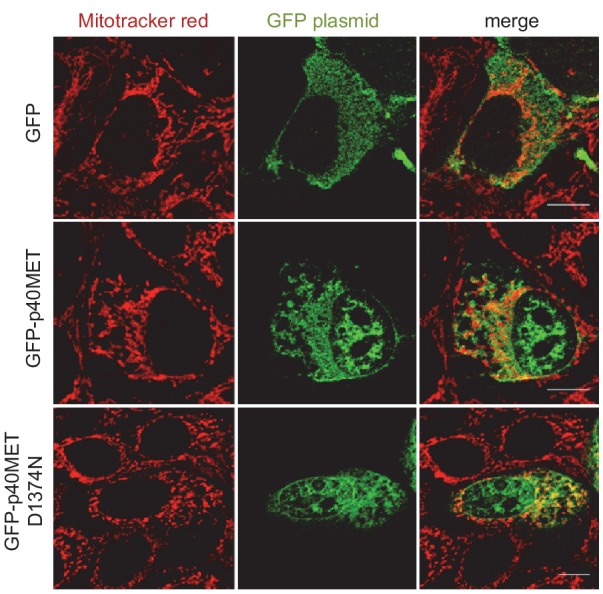
Figure 1—figure supplement 3. Partial overlap between GFP-p40MET and mitotracker signals acquired by immunofluorescence.


