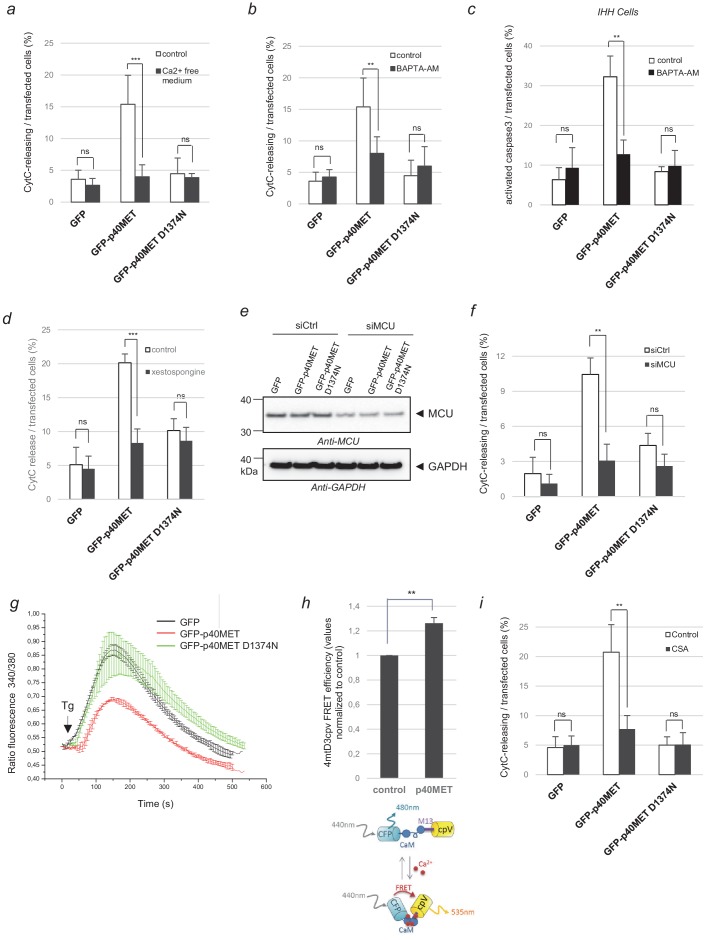
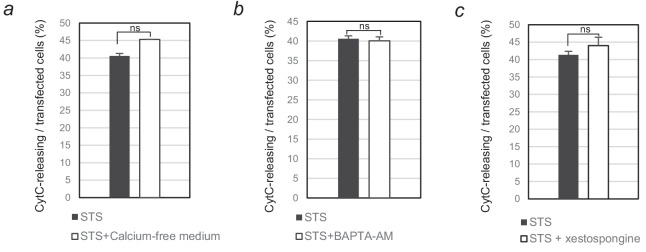
Figure 3. Evaluation of p40MET-induced apoptosis after inhibition of calcium exchanges between the ER and mitochondria.
(a, b) MCF10A epithelial cells were starved overnight in a calcium-free medium or treated with the calcium chelator BAPTA-AM (10 µM). The next day cells were transfected with a vector expressing a GFP-tagged fragment. (c) IHH cells were transfected with a vector expressing a GFP-tagged fragment and treated the next day with the calcium chelator BAPTA-AM (10 µM) for 24 hr. (d) MCF10A cells were transiently transfected with a vector expressing GFP, GFP-p40MET, or GFP-p40MET D1374N and treated or not with the IP3R inhibitor xestospongin-B (5 µM). (a–d) After 24 hr transfection for MCF10A and 48 hr for IHH, cells were fixed and processed for immunostaining with an anti-cytochrome C or anti-cleaved caspase 3 antibody to evaluate apoptosis. The percentage of cytochrome C release or of cleaved caspase-3-positive cells was determined with respect to the number of GFP positive cells. At least 100 cells were counted per well (n = 6;± S.D.) for MCF10A and at least 60 cells (n = 4;± S.D.) for IHH. (e–f) One day before transfection with a vector expressing a GFP-tagged fragment, MCF10A cells were transfected with a control siRNA or with a mixture of three siRNAs targeting the mitochondrial calcium channel MCU. Twenty-four hours later, (e) one part of the cells was lysed and extracts were analyzed by western blotting with an anti-MCU and an anti-GAPDH antibody. (f) For immunofluorescence, staining was performed with an anti-cytochrome-c antibody and nuclei were labeled with Hoechst. The percentage of transfected cells displaying cytochrome-c release was determined. At least 60 cells were counted per well (n = 3;± S.D.). (g) HEK293 cells were transfected with a vector expressing a GFP-tagged fragment. The next day, the cells were incubated in Ca2+-free HBS solution and treated with 1 µM Thapsigargin (Tg). The calcium concentration was determined by estimating the uncorrected 340 nm/380 nm fluorescence ratio of fura-2AM. At least 20 cells were measured per condition (n = 3;± S.D.). The presented results are representative of three independent experiments. Black arrows indicate Tg injection. (h) HEK293 cells were co-transfected with the 4mtD3cpv biosensor and a plasmid encoding either GFP or GFP-p40MET. The CFP fluorescence lifetime was recorded and the FRET efficiency, indicative of the calcium level in the mitochondria, was calculated with respect to the level observed for the control, set as reference. At least 30 cells were counted for each condition (n = 3;± S.D.). Below, schematic representation of the 4mtD3cpv biosensor constituted by two fluorescent probes linked by a calmodulin binding site, allowing FRET measurement. (i) MCF-10A epithelial cells were transiently transfected with a vector expressing GFP, GFP-p40MET, or GFP-p40MET D1374N and were treated or not with 2.5 μM cyclosporinA (CSA). Twenty-four hours after transfection, the nuclei were stained with Hoechst and immunofluorescence staining was performed with an anti-Flag antibody and an anti-cytochrome C antibody. The percentage of MET-transfected cells displaying cytochrome C release was determined. At least 200 cells were counted per well (n = 3;± S.D.). ns, non significant; *, p<0.05; **, p<0.01 as determined by Student’s t test.


