. 2020 Feb 24;9:e50041. doi: 10.7554/eLife.50041

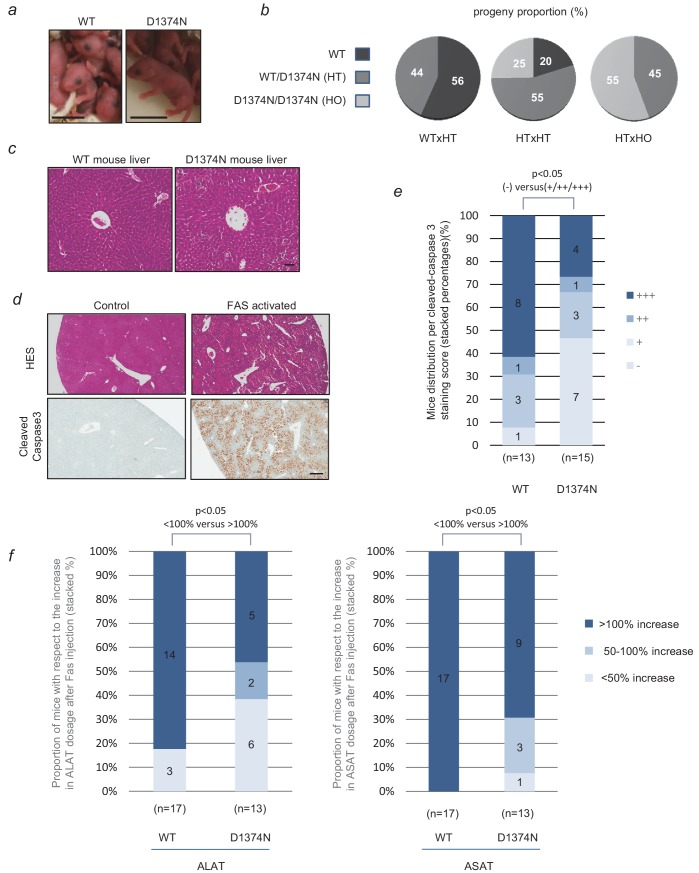
Figure 6. Evaluation of hepatocytes apoptosis in WT and D1374N mice.

(a) Pictures of newborn wild-type (WT) and MET D1374N mice; scale bar = 1 cm. (b) Pie chart representation of the proportions of WT, heterozygous (HT) and homozygous (HO) progeny obtained by crossing mice with different genotypes. (c) WT and MET D1374N mouse liver sections stained with hematoxylin/eosin, showing a hepatic lobule with a centro-lobular vein at the center; scale bar = 50 µm. (d) Example of hematoxylin/eosin and cleaved-caspase 3 staining (brown) in the livers of WT mice pretreated before the experiment with 100 µl of 5 mg/ml Crizotinib and then treated for 4 hr with Jo-2 antibody against FAS (4 µg/20 g mouse weight); scale bar = 300 µm. (e) WT and D1374N mice were treated as reported in (d). The total liver area and cleaved caspase-3 staining area were quantified for each slide. The data represent the distribution of cleaved-caspase 3 staining scores (-: 0% to 2%; +: 2% to 5%; ++: 5% to 10%; +++:>10%). In each column, the number of mice obtaining each score is indicated. Statistical analysis applied to differences in negative (-) and positive (+, ++ and +++) staining between WT and D1374N. p<0.05 was determined by Fisher test (WT: n = 13; D1374N: n = 15). (f) WT and D1374N mice were treated as reported in (d). Blood samples were collected just before and 4 hr after Jo-2 antibody treatment. The graphs represent the distribution of the evolution of plasma ALAT (left) or ASAT (right) levels between these 2 time points (up to 50% increase, 50–100% increase or more than 100% increase). Statistical analysis applied to differences in <100% increase and >100% increase between WT and D1374N. p<0.05 was determined by Fisher test (WT: n = 17; D1374N: n = 13).

Figure 6—source data 1. Source data of Figure 6e reporting percentage of active caspase 3 in liver IHC, repartition in staining score (-;+;++;+++), computation of the percentages, diagram conception and statistical analyses; source data of Figure 6f reporting ALAT and ASAT concentration in mouse blood, relative increase, diagram conception and statistical analyses.

Figure 6.

Figure 6—figure supplement 1. Mammary gland organization in WT and MET D1374N mice.

Figure 6—figure supplement 1.

Whole-mount morphology of WT and MET D1374N mammary glands. Pairs #5 of 3-month-old mice were harvested, laid over microscopy slides, and incubated overnight with Carnoy’s fixative. Glands were subsequently stained with Carmine Alum stain, cleared with xylene, and mounted with Permount mounting medium. WT and MET D1374N mammary glands display similar organization, with comparable levels of branching morphogenesis in the whole gland volume.
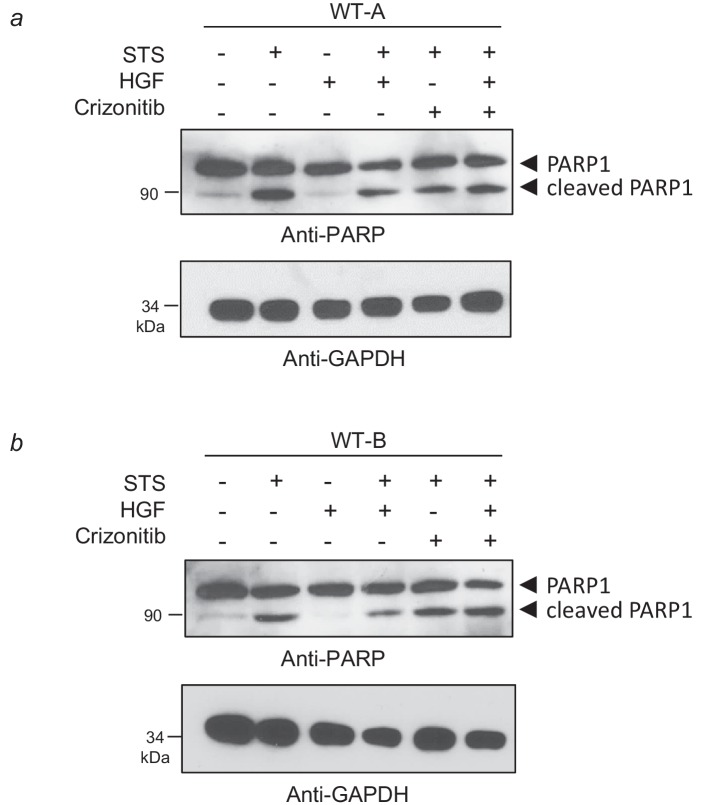
Figure 6—figure supplement 2. Evidence of Crizotinib efficacy against HGF-induced survival in BMEL cells.

Figure 6—figure supplement 2.

(a–b) WT BMEL cells were cultured on a 6-well plate coated with poly-L-lysine. The next day, they were treated or not for 4 hr with 1 µM staurosporine, 20 ng/ml HGF/SF, or 0.1 µM Crizotinib. For each condition, the same amount of whole cell lysate was resolved by SDS-PAGE and analyzed by western blotting with antibodies against PARP1 and GAPDH.
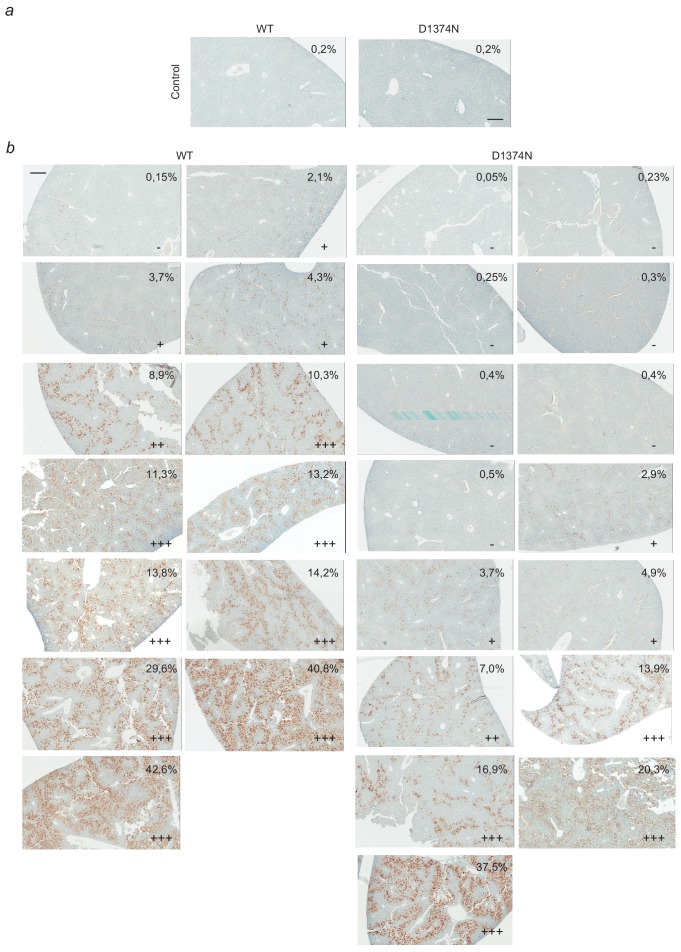
Figure 6—figure supplement 3. Complete-panel illustration of cleaved-caspase 3 staining of liver slices.

Figure 6—figure supplement 3.

(a–b) Photographs of all mouse livers (WT and D1374N) stained with antibody against cleaved caspase 3. Mice were pretreated with Crizotinib 5 days, 2 days, and 1 day before the experiment and fulminant hepatitis was induced (b) or not (a) by Jo-2 injection (4 hr). Scores determined according to the proportion of stained area over the liver slice area (from negative - to highly positive +++) are indicated on each picture; scale bar = 300 µm.