Figure 2:
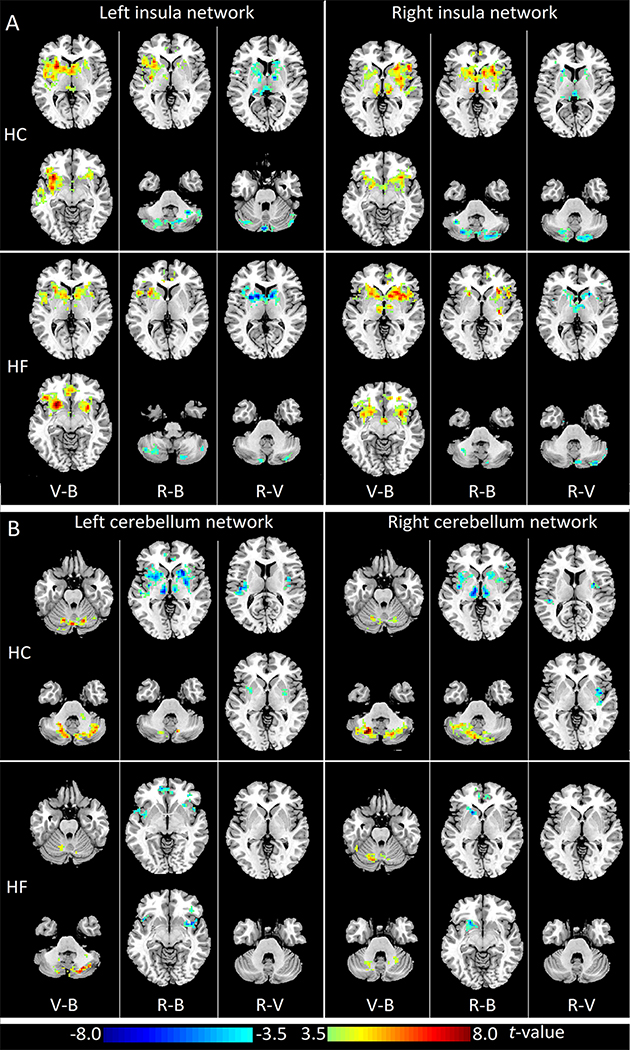
Changes of insular and cerebellar functional connectivity (FC) during the different phases of Valsalva maneuver in healthy controls and heart failure subjects. (A) Paired t-tests (FDR corrected p<0.05) of left insular FC maps (left panel) and right insular FC maps (right panel) in HC (upper panel) and HF (lower panel). (B) Paired t-tests (FDR corrected p<0.05) of left cerebellum FC maps (left panel) and right cerebellum FC maps (right panel) in HC (upper panel) and HF (lower panel). Three columns in each sub figure represent results of comparisons between different phases, from left to right: Valsalva challenge phase vs. baseline (V-B), recovery phase vs. baseline (R-B), and recovery phase vs. Valsalva challenge (R-V). Two representative slices in neurological convention are shown for each comparison. Warm color indicates increased FC values, cold color shows decreased FC values. HC: healthy controls; HF: heart failure.

