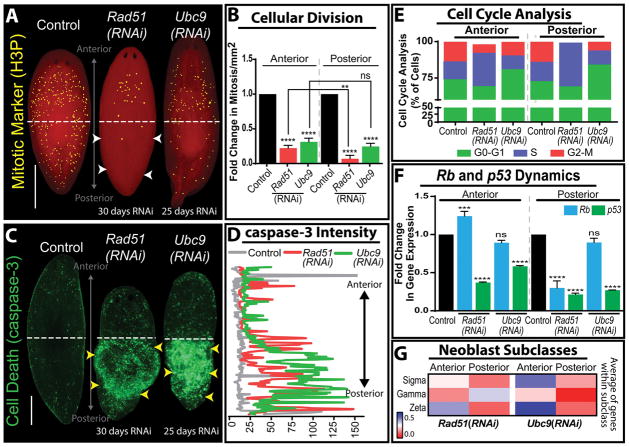
Figure 5. Rad51 and Ubc9 inhibition in planaria yields high levels of DSB and region-specific neoblast responses.
(A) Whole mount immunostaining of mitotic neoblasts marked by Histone3 phosphorylated (H3P) in mock control, Rad51(RNAi) and Ubc9(RNAi) models. Note the difference in mitotic cells along the anteroposterior axis in the Rad51(RNAi) group; white arrow heads indicate a severe decrease in mitosis in the posterior versus the anterior. (B) Levels of mitotic cells across the anteroposterior axis, confirms the asymmetric distribution of mitoses is specific to Rad51(RNAi) but not to animals subjected to Ubc9(RNAi). (C) Whole mount immunostaining of cell death marked by the caspase-3 antibody. Note the increase of apoptotic events (green signal) is concentrated in the posterior region of both Rad51(RNAi) and Ubc9(RNAi) animals (yellow arroheads). (D) Quantification of the fluorescent intensity signal from caspase-3 stained Rad51(RNAi) and Ubc9(RNAi) animals confirming the increased cell death in the posterior regions compared to the anterior and control (yellow arrowheads coincide with the increase in cell death). Intensity readings were obtained by tracing a line in the middle of the animal from the anterior to the posterior region using ImageJ software. (E) Cell cycle analysis using flow cytometry in cells dissociated from the anterior and posterior regions in animals subjected to Rad51(RNAi) and Ubc9(RNAi). Different phases of the cell cycle are color coded and show that Rad51(RNAi) and Ubc9(RNAi) animals display different effects on cell cycle repsented by important reduction in M-phase in the posterior region of Rad51(RNAi), while Ubc9(RNAi) animals tend to halt cell cycle in G0/G1 phases but some cells still continue to divide. (F) Fold change in gene expression of Rb and p53 relative to the control. Rb expression is asymmetrically upregulated in the anterior of Rad51(RNAi) but it does not appear affected in the same manner after Ubc9(RNAi). (G) Heat map, representing fold change in the average of gene expression of neoblast subclass (sigma, gamma, zeta) markers in the anterior and posterior regions. Red indicates diminished gene expression and blue increased gene expression. **p < 0.01; ***p < 0.001; ****p < 0.0001; two-way-ANOVA. Scale bars: 200μm.

