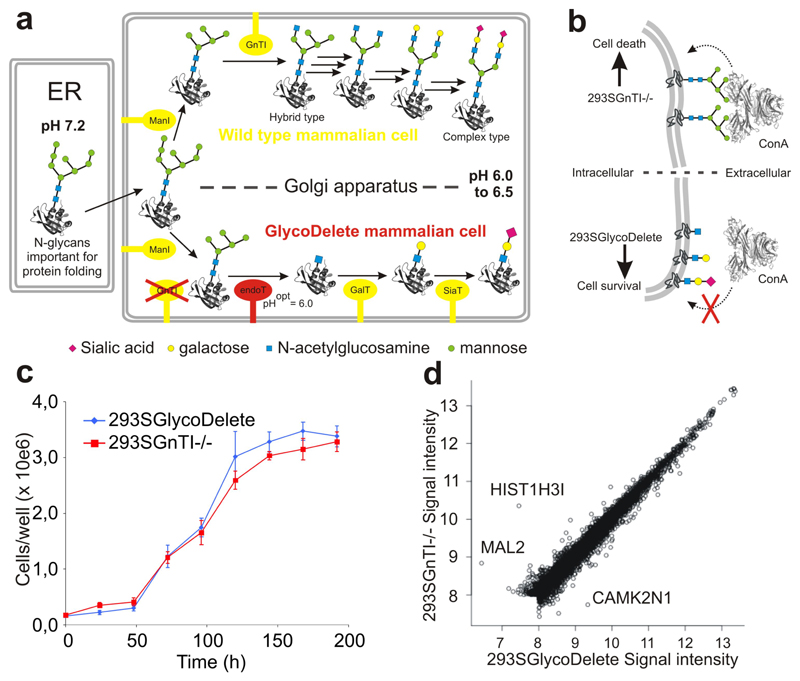
Fig. 1. The GlycoDelete strategy & cell line characterization.
(a) In mammalian cells with intact glycosylation machinery (a; upper part), oligomannose glycans entering the Golgi are trimmed by class I mannosidases (ManI) to Man5GlcNAc2. They are committed to hybrid or complex type N-glycans after modification by N-acetylglucosaminyltransferase 1 (GnTI) with a β-1,2-N-acetylglucosamine on the α-1,3-mannose. Several glycosylhydrolases and glycosyltransferases further model complex type N-glycans through many biosynthetic steps (black arrows; enzymes not shown), leading to substantial heterogeneity. In GlycoDelete cells, (a; lower part) GnTI is deleted and endoT is targeted to the Golgi, resulting in hydrolysis of oligomannose N-glycans by endoT. The resulting single GlcNAc stumps can be elongated by Golgi-resident galactosyl- and sialyltransferases. (b) Concanavalin A selection directly selects for the desired GlycoDelete glycan phenotype, as deglycosylation of cell surface glycoproteins by endoT results in the absence of ConA ligands, rendering cells resistant to ConA. The parental 293SGnTI-/- cells die when treated with ConA. (c) Growth curve for 293SGnTI-/- and 293SGlycoDelete cells in 6-well culture plates, counted every 24 hours. Error bars are standard deviations (S.D.), n=3. Numerical data for this graph are in Supplementary Table 2. (d) Scatterplot of average (n=3) gene expression values of 7344 genes for 293SGlycoDelete versus 293SGnTI-/- cells. The correlation coefficient is 0.9865. Significantly differentially expressed genes (P<0.01) are labeled with their names. Microarray signal intensities lower than 8 on the represented scale were too low for reliable detection.

