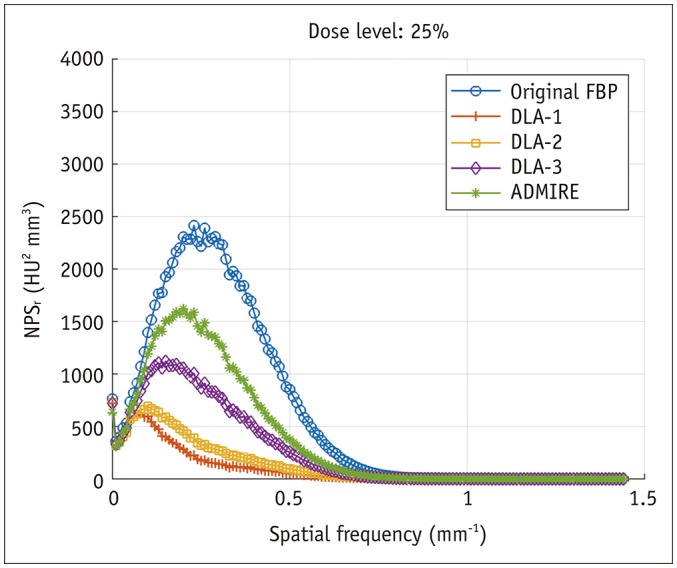
Fig. 2. NPS of 25% dose CT of phantom according to reconstruction method.

NPS curves are shifted towards lower spatial frequencies in images produced by DLAs trained at lower radiation dose level. HU = Hounsfield unit, NPS = noise power spectrum

NPS curves are shifted towards lower spatial frequencies in images produced by DLAs trained at lower radiation dose level. HU = Hounsfield unit, NPS = noise power spectrum