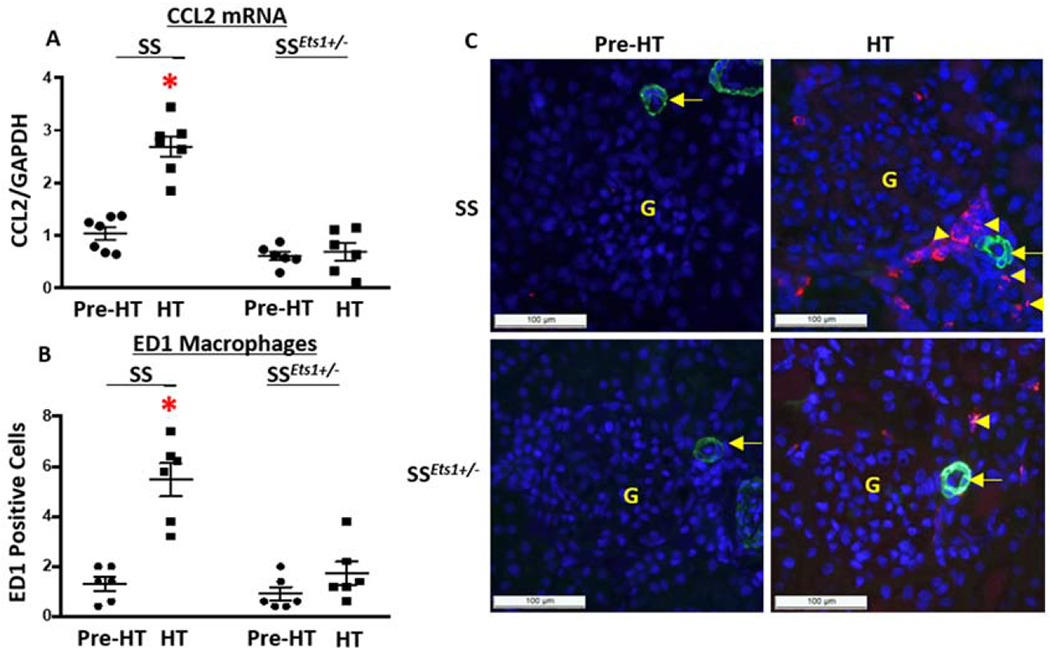
Figure 3. Expression of CCL2 in kidney microvasculature increased in HT SS rats and was accompanied by peri-microvascular accumulation of macrophages.

A, Basal relative level of mRNA of CCL2 in dissected kidney microvessels of Pre-HT SS rats was slightly increased when compared with relative mRNA levels from microvessels of Pre-HT SSEts1+/− rats. Kidney microvascular CCL2 further increased in HT SS and was significantly higher than that in the HT SSEts1+/− rats. *p-value < 0.05 versus Pre-HT SS, Pre-HT SSEts1+/−, and HT SSEts1+/− groups; n=6 animals in each group B and C, Immunofluorescence microscopy using alpha-smooth muscle actin (SMA) antibody (Green) to outline the afferent arteriole and ED1 antibody (Red) to stain macrophages showed low basal levels of ED1-positive macrophages (Red) in both Pre-HT SS and SSEts1+/− rats, but increased around the kidney microvasculature in HT SS rats, compared with the HT SSEts1+/− rats. *p-value < 0.05 versus Pre-HT SS, Pre-HT SSEts1+/−, and HT SSEts1+/− groups; n=6 animals in each group. G, glomerulus.
