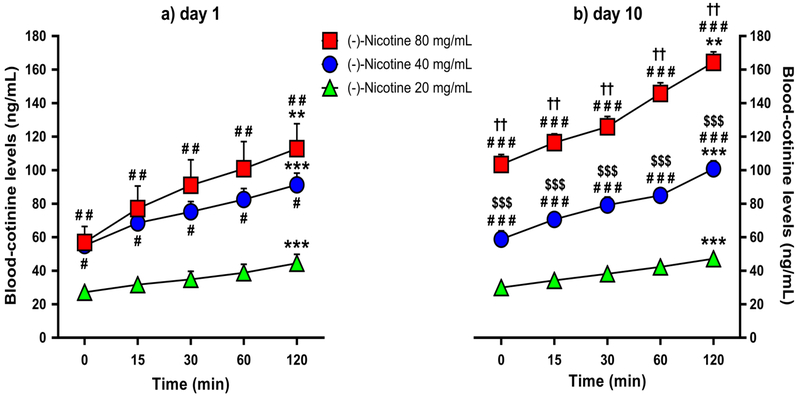
Fig. 3.
Mean blood-cotinine levels (+SEM) over time in the 20, 40 and 80 mg/mL nicotine concentration groups (N=6/group) following the 1st (panel a) and 10th (panel b) day of nicotine e-vape exposure. ** p≤0.01 and *** p≤0.001 compared with baseline; # p≤0.05, ## p≤0.01 and ### p≤0.001 compared with the 20 mg/mL nicotine group; $$$ p≤0.001 compared with the 80 mg/mL nicotine group; †† p≤0.01 compared with day 1. Significance symbols are reported over and under the corresponding dataset.

