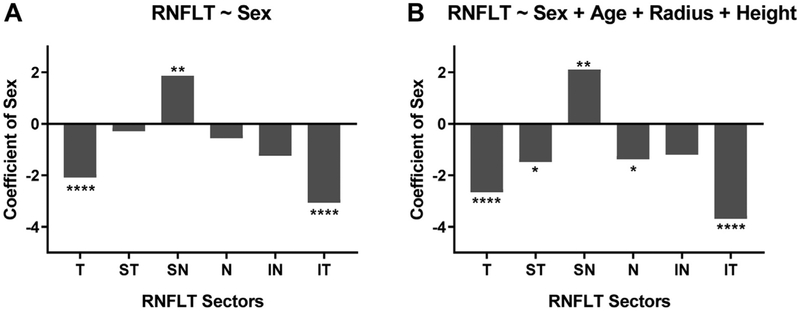
Figure 5.
A, Graph showing linear regression between 6-sector retinal nerve fiber layer thickness (RNFLT) and sex. B, Graph showing multivariable linear regression for 6-sector RNFLT and sex with correction for the effect of age, scanning circle radius, and body height. In both graphs, males are coded as 1 and females are coded as 0. The y-axis denotes the regression coefficient for sex only. Significance level: *P ≤ 0.05, **P ≤ 0.01, ***P ≤ 0.001, and ****P ≤ 0.0001. IN = inferonasal; IT = inferotemporal; N = nasal; SN = superonasal; ST = superotemporal; T = temporal.

