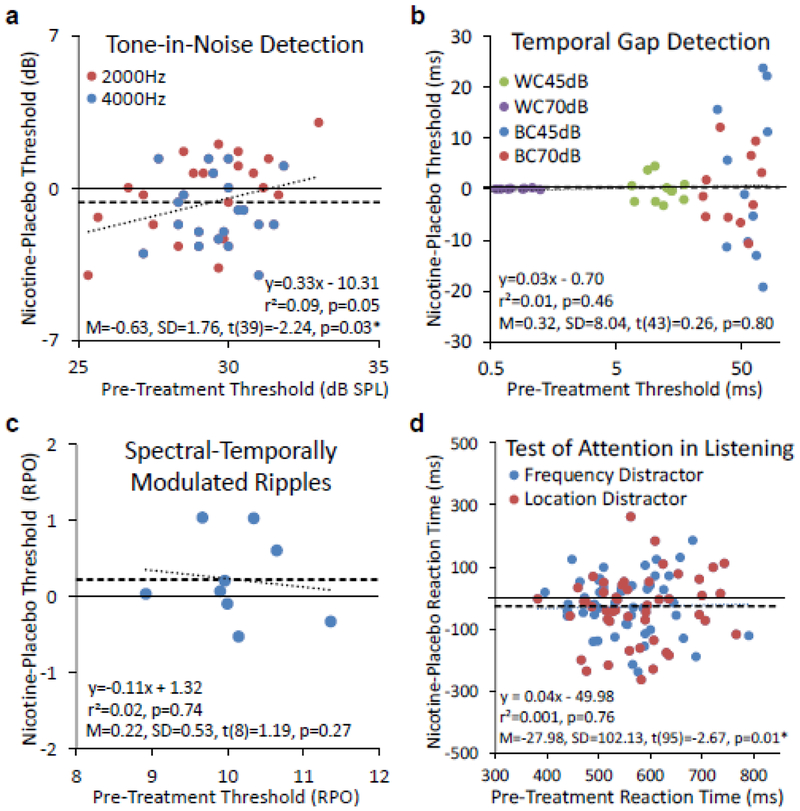
Figure 2.
Post-treatment placebo and nicotine difference as a function of pre-treatment baseline performance in four auditory experiments. a. Tone-in-noise detection. Individual data are represented by circles (red for 2000 Hz and blue for 4000 Hz). The mean difference is represented by the thick dashed horizontal line. The regression line is represented by the dotted line. The text box shows the linear regression equation (top), r2 and p value (middle), and the mean difference, standard deviation, and the one-sample t-test result (bottom). The same convention is applicable to panel b, c, and d. b. Temporal gap detection. WC=Within-Channel, BC=Between-Channel. c. Spectral-Temporally modulated ripple discrimination. RPO=Ripples Per Octave. d. Selective attention.

