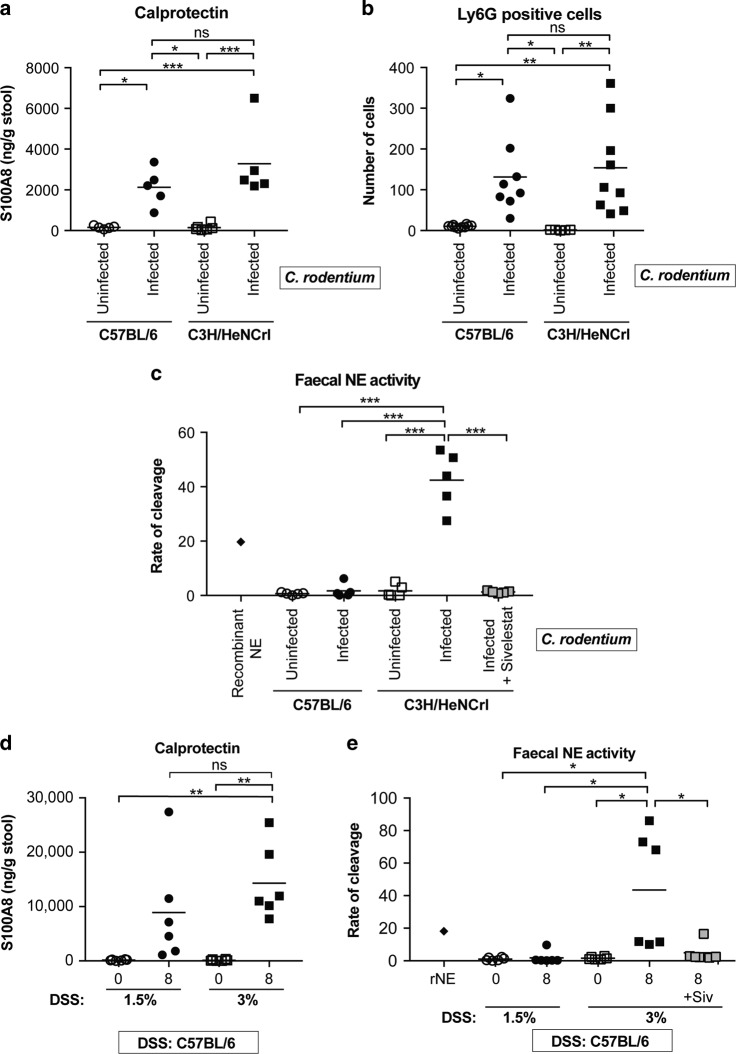
Fig. 2. NE activity reflects severity of disease induced by C. rodentium and DSS.
a Levels of S100A8 (calprotectin) in faeces from uninfected and infected mice (8 dpi: C57-closed circles; 6 dpi: C3H-closed squares) as determined by ELISA. Multiple comparison one-way ANOVA, n.s. = non-significant, *P ≤ 0.05, ***P ≤ 0.001. b The number of Ly6G-positive cells were counted per colonic section from individual mice (n = 8–9). Multiple comparison one-way ANOVA, n.s. = non-significant, *P ≤ 0.05, **P ≤ 0.01. Representative images shown Fig. S2. c Measurements of faecal NE activity in uninfected and infected (C57, 8 dpi-closed circles; C3H, 6 dpi-closed squares) mice, measured using a fluorogenic tetrapeptide substrate. Purified recombinant NE was used as a control (diamond). Grey squares indicate samples treated with Sivelestat. Multiple comparison one-way ANOVA, ***P ≤ 0.001. d Faecal S100A8 ELISA (calprotectin) of samples taken from C57 mice pre-treatment (0) and at 8 days post treatment (1.5% DSS- closed circles; 3% DSS- closed squares). Multiple comparison one-way ANOVA, n.s. = non-significant, **P ≤ 0.01. e Faecal NE activity in samples from C57 mice pre-treatment (0) and at 8 days post treatment (1.5% DSS- closed circles; 3% DSS- closed squares). Purified rNE was used as a control (diamond). Grey squares indicate samples treated with Sivelestat. Multiple comparison one-way ANOVA, *P ≤ 0.05.

