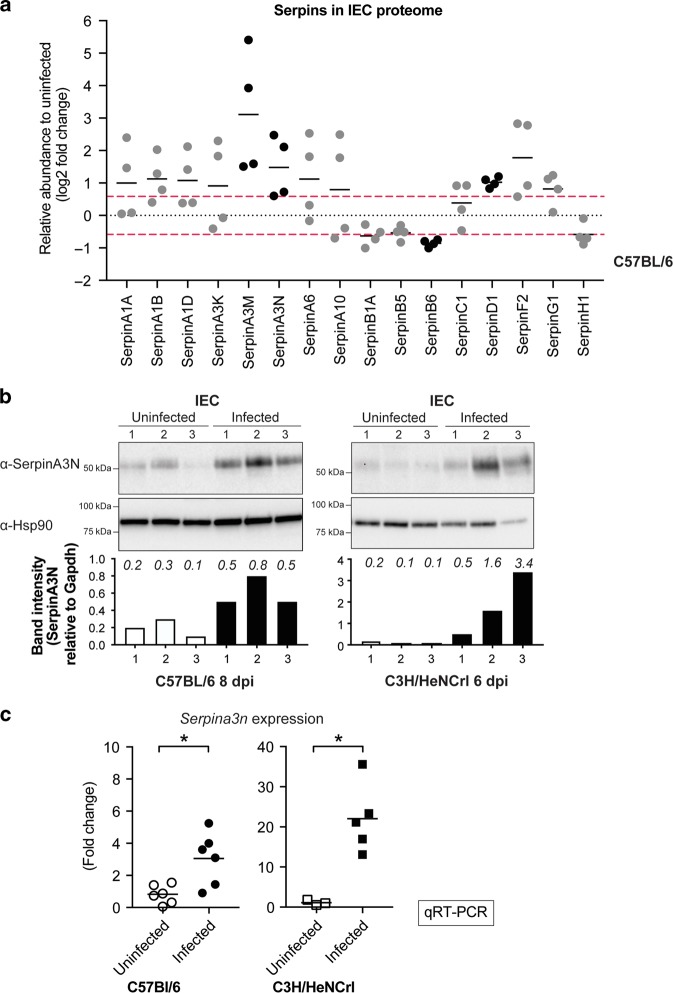
Fig. 4. SerpinA3N is produced by infected IECs.
a Log 2 fold change of Serpins identified in proteomic analysis of IECs from uninfected and infected C57 (8 dpi) mice. Black dots indicate proteins with increased or decreased abundance above or below 1.5-fold change, log 2: 0.585 (red line) in four individual experiments: SerpinA3M, SerpinA3N, SerpinB6, SerpinD1. b Western blot analysis using anti-SerpinA3N antibody on enriched IECs samples from three uninfected and three infected C57 and C3H mice. Anti-Hsp90 was used as a loading control. Bar graph below blot is quantification of SerpinA3N band relative to loading control; the actual values are indicated in italics above each bar. c mRNA levels of Serpina3n expressed by infected and uninfected IECs measured by qRT-PCR relative to Gapdh control. Values are expressed as ΔΔCT relative to uninfected, Mann–Whitney test, *P ≤ 0.05.

