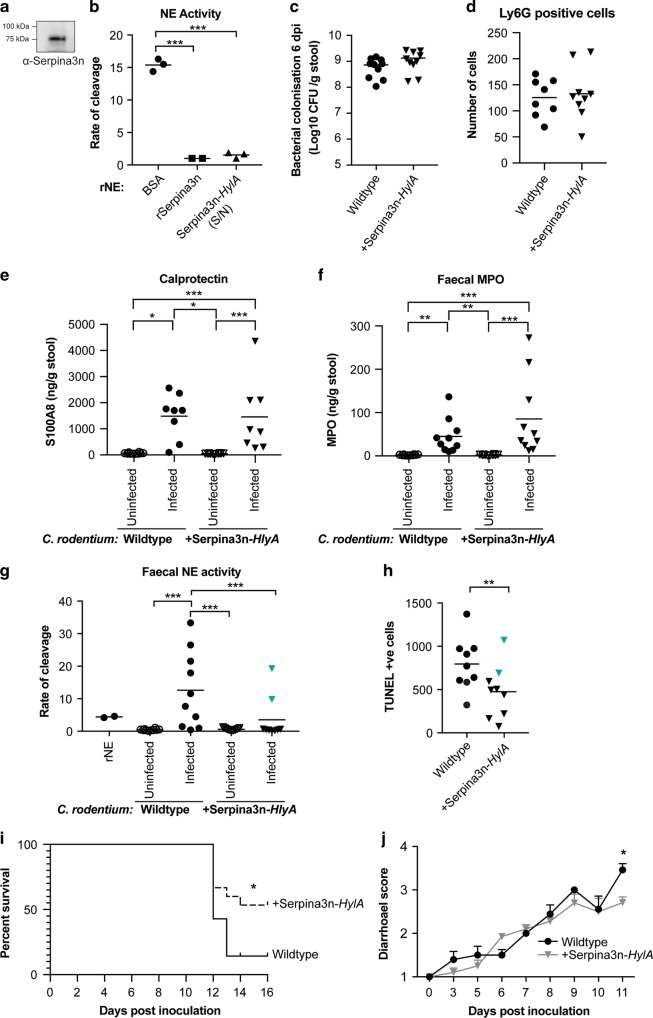
Fig. 7. Delivery of SerpinA3N at the site of infection reduces faecal NE activity and disease severity in C3H mice.
a Western blot analysis of SerpinA3N-HylA in a culture supernatant obtained from ICC2031. b Rate of cleavage of NE substrate by 10 nM recombinant neutrophil elastase (rNE) following incubation with BSA (control), affinity-purified SerpinA3N-HlyA and rSerpinA3N. c Shedding of WT C. rodentium (circles) and ICC2031 (inverted triangles) upon infection of C3H mice. Number of CFU/g of stool was measured 6 dpi. d The number of Ly6G-positive cells were counted per colonic section from individual mice (n = 8–9). e S100A8 ELISA (calprotectin) shows no significant difference between mice infected with WT C. rodentium (circles) and ICC2031 (inverted triangles) at 6 dpi. Multiple comparison one-way ANOVA was performed; *P ≤ 0.05, ***P ≤ 0.001. f MPO ELISA shows no significant difference between mice infected with WT C. rodentium (circles) and ICC2031 (inverted triangles) at 6 dpi. Multiple comparison one-way ANOVA was performed; **P ≤ 0.01, ***P ≤ 0.001. g Analysis of faecal NE activity in samples collected pre-infection (uninfected) and 6 dpi. Cyan inverted triangles indicates outliers determined by ROUT test, Q = 0.5%. Multiple comparison one-way ANOVA was performed, ***P ≤ 0.001. h Quantification of the number of TUNEL-positive cells per transverse section of colons from individual mice. Cyan inverted triangles correspond to outliers based on NE activity. Mann–Whitney test, **P ≤ 0.01. i Survival curve of C3H mice infected with WT C. rodentium (n = 14) and ICC2031 (n = 15); combined data from three biological repeats. Comparison of survival curves by log-rank (Mantel–Cox) test; *P = 0.0302. j Diarrhoeal score of mice infected with WT C. rodentium (n = 14; black line) and ICC2031 (n = 15; grey line) over time; combined data from three biological repeats. Multiple t tests, *P ≤ 0.05 (11 dpi).

