Fig. 4.
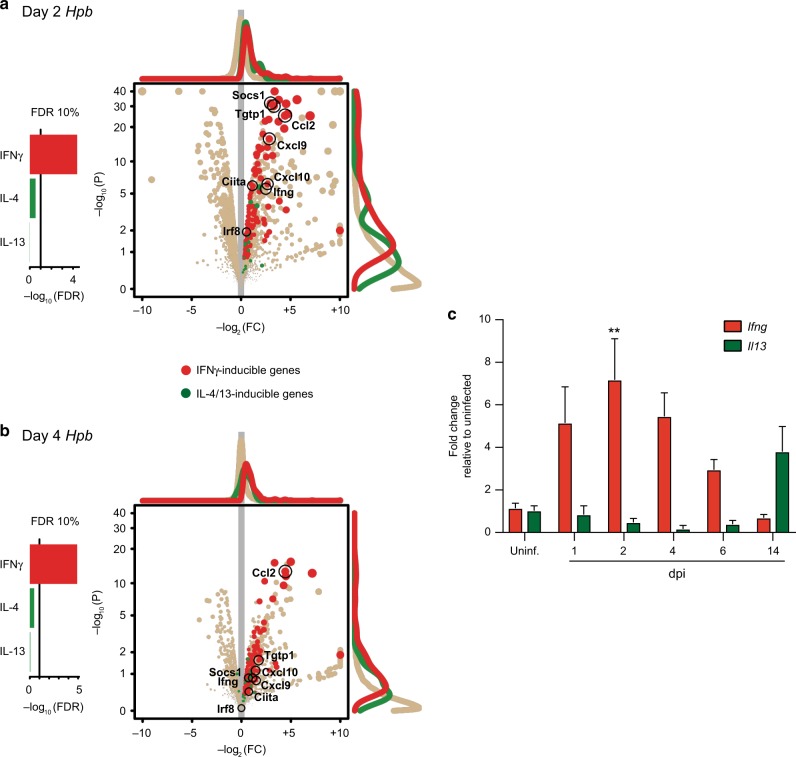
A Type 1 immune response dominates early Hpb infection. RNA sequencing results comparing duodenal tissue from uninfected to Hpb-infected mice. IFNγ-inducible genes (red) are indicative of a Type 1 immune response, while IL-4/13-inducible genes (green) represent a Type 2 immune response. Pathway analyses show response to cytokine (IFNγ; Gene Ontology’s GO:0034097), response to Interleukin-4 (IL4; GO:0070670), and response to Interleukin-13 (IL-13; GO:0035962) (left panels). Statistical significance chosen at the FDR 10% level. Volcano plot shows P value (P) of gene expression fold change (FC) for each gene (dot) (right panels). Histograms of data points represented as curves. Selected genes are highlighted. a Day 2 Hpb infection vs uninfected. b Day 4 Hpb infection vs uninfected (n = 2 mice per group). c Fold change relative to uninfected for Ifng and Il13 mRNA expression in uninfected and Hpb-infected WT duodenal tissue (n = 2–11). c Data were analyzed by one-way ANOVA with Dunnet’s post test for multiple comparisons, using uninfected as the control group (**p < 0.01). Error bars, SEM.

