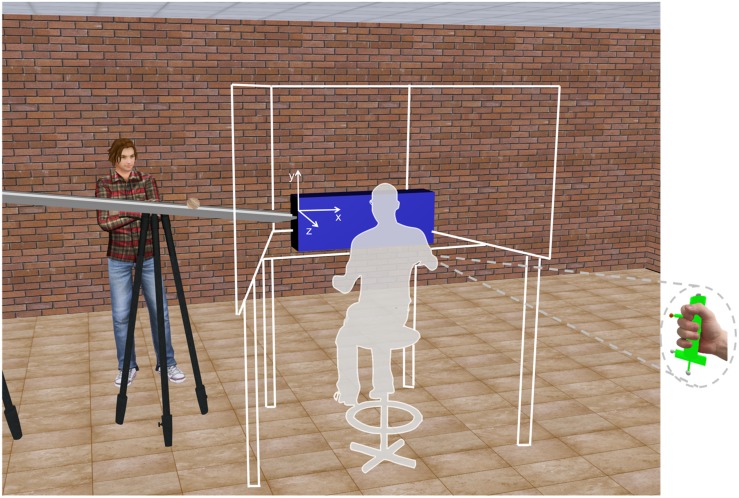
FIGURE 1.
Schematic of the experimental setup and visual scenario. The white lines and the gray area indicate the position of the mini-CAVE and the participant, respectively. The x,y,z reference system on the blue cuboid is shown for illustrative purpose only (it was not present in the virtual scene). The right inset shows the hitter held by the participant.

