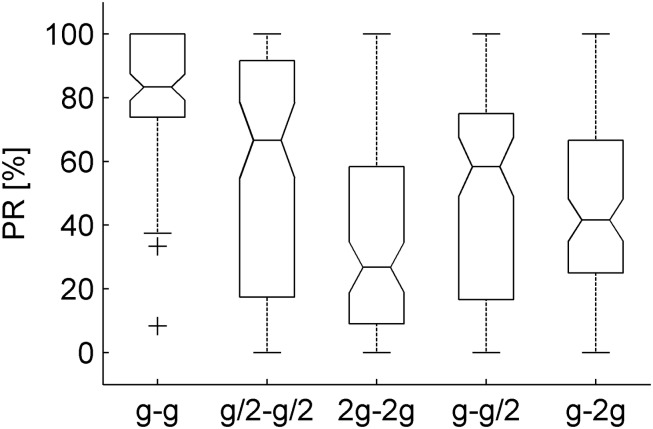
FIGURE 5.
Perception rates of natural motion plotted separately for each gravity condition (three traveled distances × two visual conditions × 16 subjects, n = 96). The bottom and top of the box-and-whisker plots boxes correspond to the lower and upper quartile, respectively. The notch displays the 95% confidence interval of the median. The whiskers extend to the lowest and highest data points, without considering the outlier (cross).

