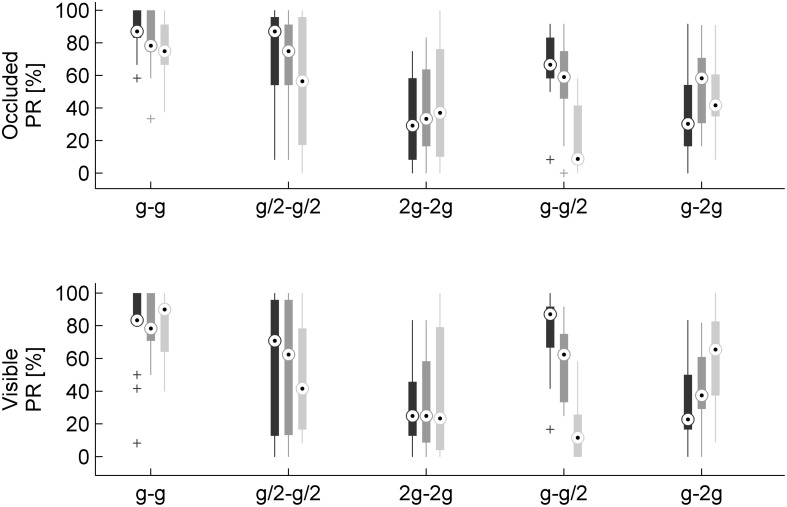
FIGURE 6.
Perception rates of natural motion for each gravity condition, visual condition, and traveled distance on the incline (n = 16 subjects). Different gray levels denote different traveled distances: 0.546, 1.093, and 2.186 m, dark to light. Other conventions as in Figure 5.

