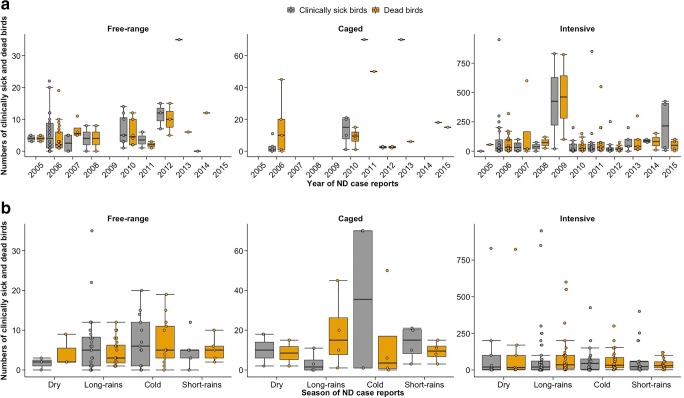
Fig. 3.
Variations in the numbers of clinically sick and dead birds across the years (a) and seasons (b) in the free-range, caged, and intensive productive systems. The numbers of affected birds depended on the productive system, with intensive system represented in every year (a). During the cold season, birds’ mortalities exceeded the clinically sick birds in the intensive system (b). Similar trends are apparent the long-rain season in the caged system, the dry and short-rain seasons in the free-range system (b)

