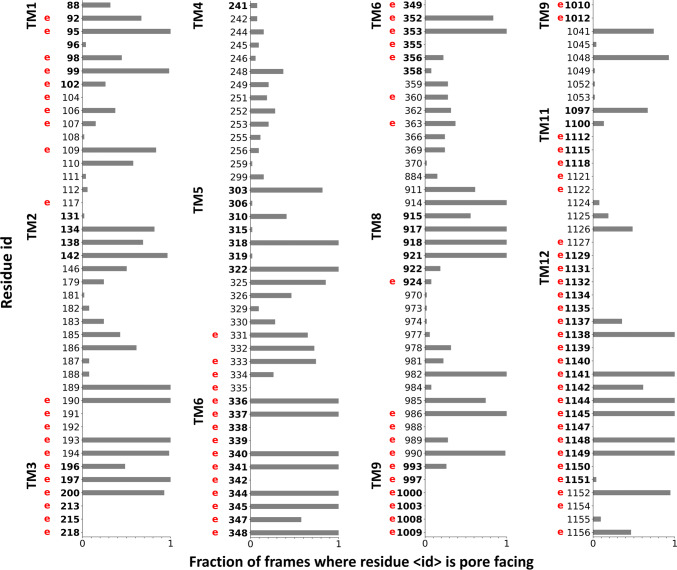
Fig. 2.
Comparing channel-lining residues identified in simulations to experimental data. Residues interacting with the Caver spheres were counted from all open frames (n = 54) and normalized. Only residues lining the channel based on in silico or in vitro data, are indicated in the plot. A letter “e” in red was placed at the residue number (human numbering) to indicate that the residue had been shown by laboratory experiments to influence the CFTR chloride conductance. Bold numbers indicate amino acids located in the TM region

