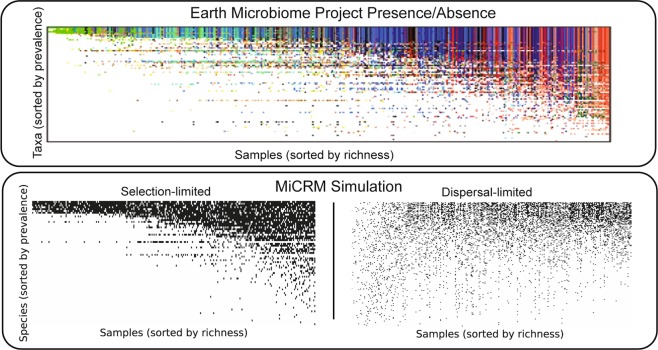
Figure 3.
Nestedness of community composition indicates selection-dominated community assembly. Top: Presence (colored) or absence (white) of each microbial phylum in a representative set of 2,000 samples from the EMP. Reproduced from Figure 3 of the EMP report1. Different colors represent different biomes. Bottom: Presence (black) or absence (white) of species in simulated communities. Two different regimes of community assembly were simulated. The first is the selection-dominated scenario of Fig. 2, where variability in diversity is produced by variations in environmental harshness, and all samples are initialized with the vast majority (150/180) of the species in the regional pool. The second is a dispersal-dominated scenario, where environmental conditions are identical for all samples, but each sample is initialized with a different number of species, varying from 1 to 180. See main text and Methods for simulation details.

