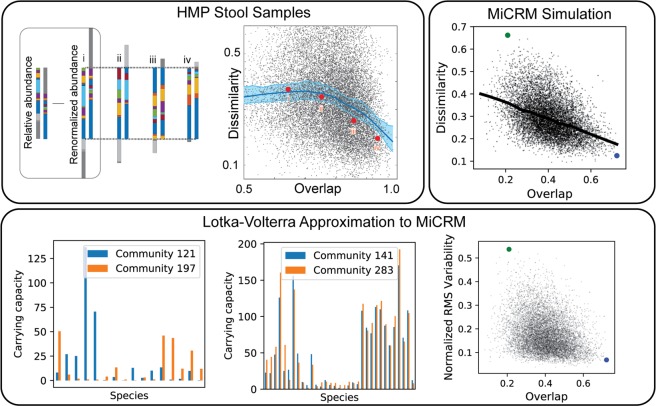
Figure 9.
Host-specific dynamics are compatible with dissimilarity-overlap correlation. Top left: The composition of pairs of samples can be compared in two independent ways: “overlap” measures the fraction of each sample comprised by species common to both, and “dissimilarity” measures how different the relative abundance profiles are within this shared pool. The four pairs shown here have increasing overlap and decreasing dissimilarity from left to right, corresponding to the four points indicated in the scatter plot. Dissimilarity and overlap are plotted for 17,955 pairs of stool samples from the HMP, analyzed at the genus level. Solid line is a Lowess smoothing of the data, and red points correspond to the sample pairs illustrated in the first panel. Reproduced with permission from33. Top right: Dissimilarity and overlap for 10,000 pairs of simulated samples from the metabolically distinct simple environments of Fig. 6, with one resource supplied from class A and one from class B. Solid line is a Lowess smoothing of the data. Blue and green points correspond to two representative pairs of communities selected for further analysis in the bottom panel. Bottom: For each sample, the population dynamics near the steady state was approximated with a generalized Lotka-Volterra model. Effective carrying capacities and interaction coefficients computed from the mechanistic model parameters together with the population sizes and resource abundances, as described in the Methods. We have plotted the carrying capacity of each species for two representative pairs of communities with low (left) and high (center) overlap. These pairs are indicated in the scatter plots by blue and green points, respectively. We also show the normalized root-mean-square variability in carrying capacity for all 10,000 sample pairs (right).

