Figure 6.
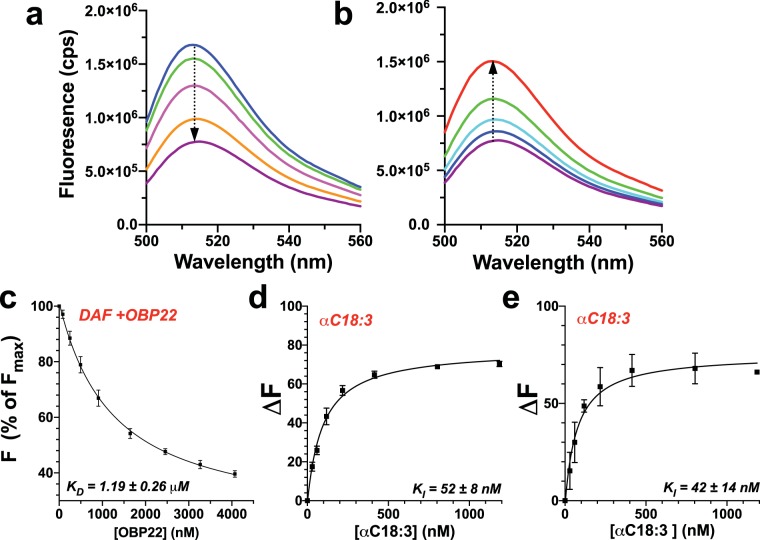
Long chain fatty acids bind with high affinity to AeOBP22. (a) Florescence emission spectra of DAF (blue) excited at 490 nm, with increasing amounts of AeOBP22 (arrow) shows concentration dependent quenching. (b) Titration of the final sample in a, with increasing linoleic acid (arrow) shows that the fatty acid competes for binding of DAF and recovery of initial fluorescence (red). (c) Determination of binding constant for AeOBP22 and DAF from 7 replicates of experiments shown in panel (a). DAF concentration was 84 nM. Plot of the intensity at the florescence maximum (513 nm) presented as change from initial fluorescence. Data were fit according to Eq. 2. (d) Determination of the binding constant of α-linoleic acid at pH 8.0 from multiple replicates (n = 3) of experiments shown in panel (b) by fit of the raw intensity using Eqs. 2 and 3 using a KD for DAF of 1.191 μM. The DAF concentration was fixed at 100 nM and the protein at 1000 nM. Data are presented as normalized recovery of the quenched fluorescence for ease of viewing. (e) The same experiment as in (d) but recorded at pH 5 (n = 2). Intrinsic DAF fluorescence is significantly quenched at pH 5.0 leading to increased error in measured points.

