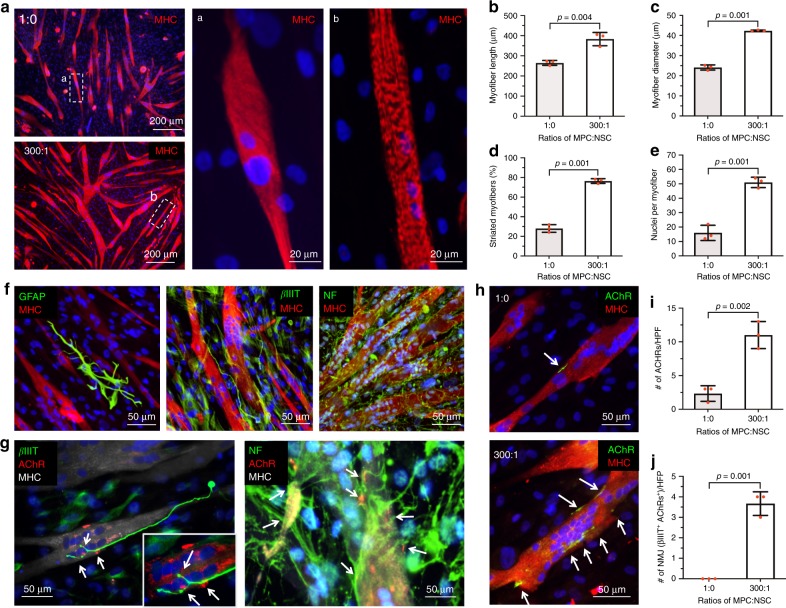
Fig. 1. Two-dimensional (2D) co-culture of human muscle progenitor cells (hMPCs) and human neural stem cells (hNSCs) with different ratios.
a Immunofluorescence for myosin heavy chain (MHC) (red)/DAPI (blue) of hMPCs culture (1:0) and co-culture (hMPCs:hNSCs = 300:1) at 5 days of differentiation; Striated myofiber structure of a hMPCs (1:0) and b co-culture of hMPCs and hNSCs (300:1). b–e Quantification of myofiber formation; b myofiber length (µm) (n = 3 per group), c myofiber diameter (µm) (n = 3 per group), d striated myofibers (%) (n = 3 per group), and e nuclei per myofiber (n = 3 per group). Co-culture group showed increased density, length, diameter, and striation of myofibers, as well as a number of nuclei per myofiber compared with the hMPCs only group. f Glial and neuronal differentiation of hNSCs in 2D co-culture. Immunofluorescence for glial fibrillary acidic protein (GFAP, glial cells, green)/MHC (red), beta-III tubulin (βIIIT, neurons, green)/MHC (red), and neurofilaments (NF, green)/MHC (red). g, h Acetylcholine receptor (AChR) clustering and neuromuscular junction (NMJ) formation (white arrows). g Immunofluorescence for βIIIT (green)/AChR (red)/MHC (gray) and NF(green)/AChR (red)/MHC (gray) in 2D co-culture. h Immunofluorescence for AChRs (green)/MHC (red) in hMPCs cultures and 2D co-culture. i The number of AChRs per field (n = 3 per group) and j co-localizations (βIIIT+ AChRs per fields) (n = 3 per group). All data are represented as mean ± SD. The p-values by two-sided Student t-test are indicated.

