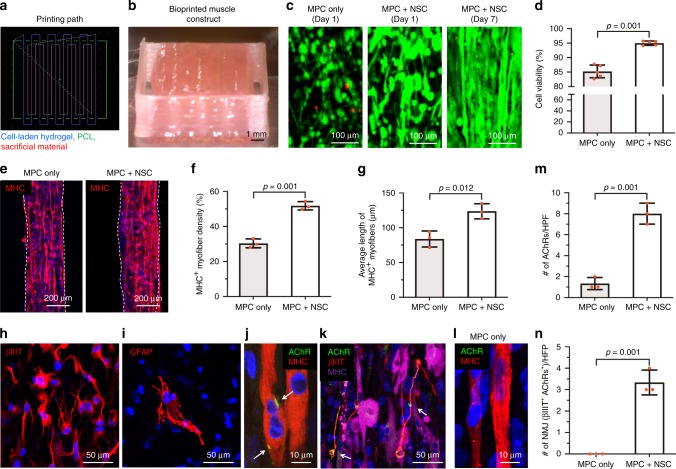
Fig. 3. In vitro evaluation of 3D bioprinted human skeletal muscle constructs.
a Printing path for cell-laden hydrogel, PCL, and sacrificial material. b Bioprinted constructs containing hMPCs and hNSCs (30 × 106 cells per ml, 10 × 10 × 3 mm3 in dimension) after printing. c Live/dead staining images of the central part of bioprinted constructs containing MPC only and MPC + NSC (300:1) at 1 and 7 days. d Quantitative cell viability (%) at 1 day after printing (n = 5 per group). e Immunofluorescence for MHC (red) of MPC only and MPC + NSC. Quantitative analysis of f MHC+ myofiber density (%) (n = 3 per group) and g average length of MHC+ myofibers (µm) at 7 days (n = 3 per group, two-sided Student’s t-test, *p = 0.012). h, i Immunofluorescence for (H) βIIIT (red) of differentiated neurons and (I) GFAP (red) of glial cells. The experimental findings were qualitatively reproduced three times. j, k Immunofluorescence for j AChR (green)/MHC (red) of AChRs pre-patterning on myotubes (white arrows) and k AChR (green)/βIIIT (red)/MHC (purple) of NMJs (white arrows). l Immunofluorescence for AChR (green)/MHC (red) of MPC only construct. m Number of AChRs per field (n = 3 per group). n Number of βIIIT+ AChR+ NMJs per field (n = 3 per group). All data are represented as mean ± SD. The p-values by two-sided Student t-test are indicated.

